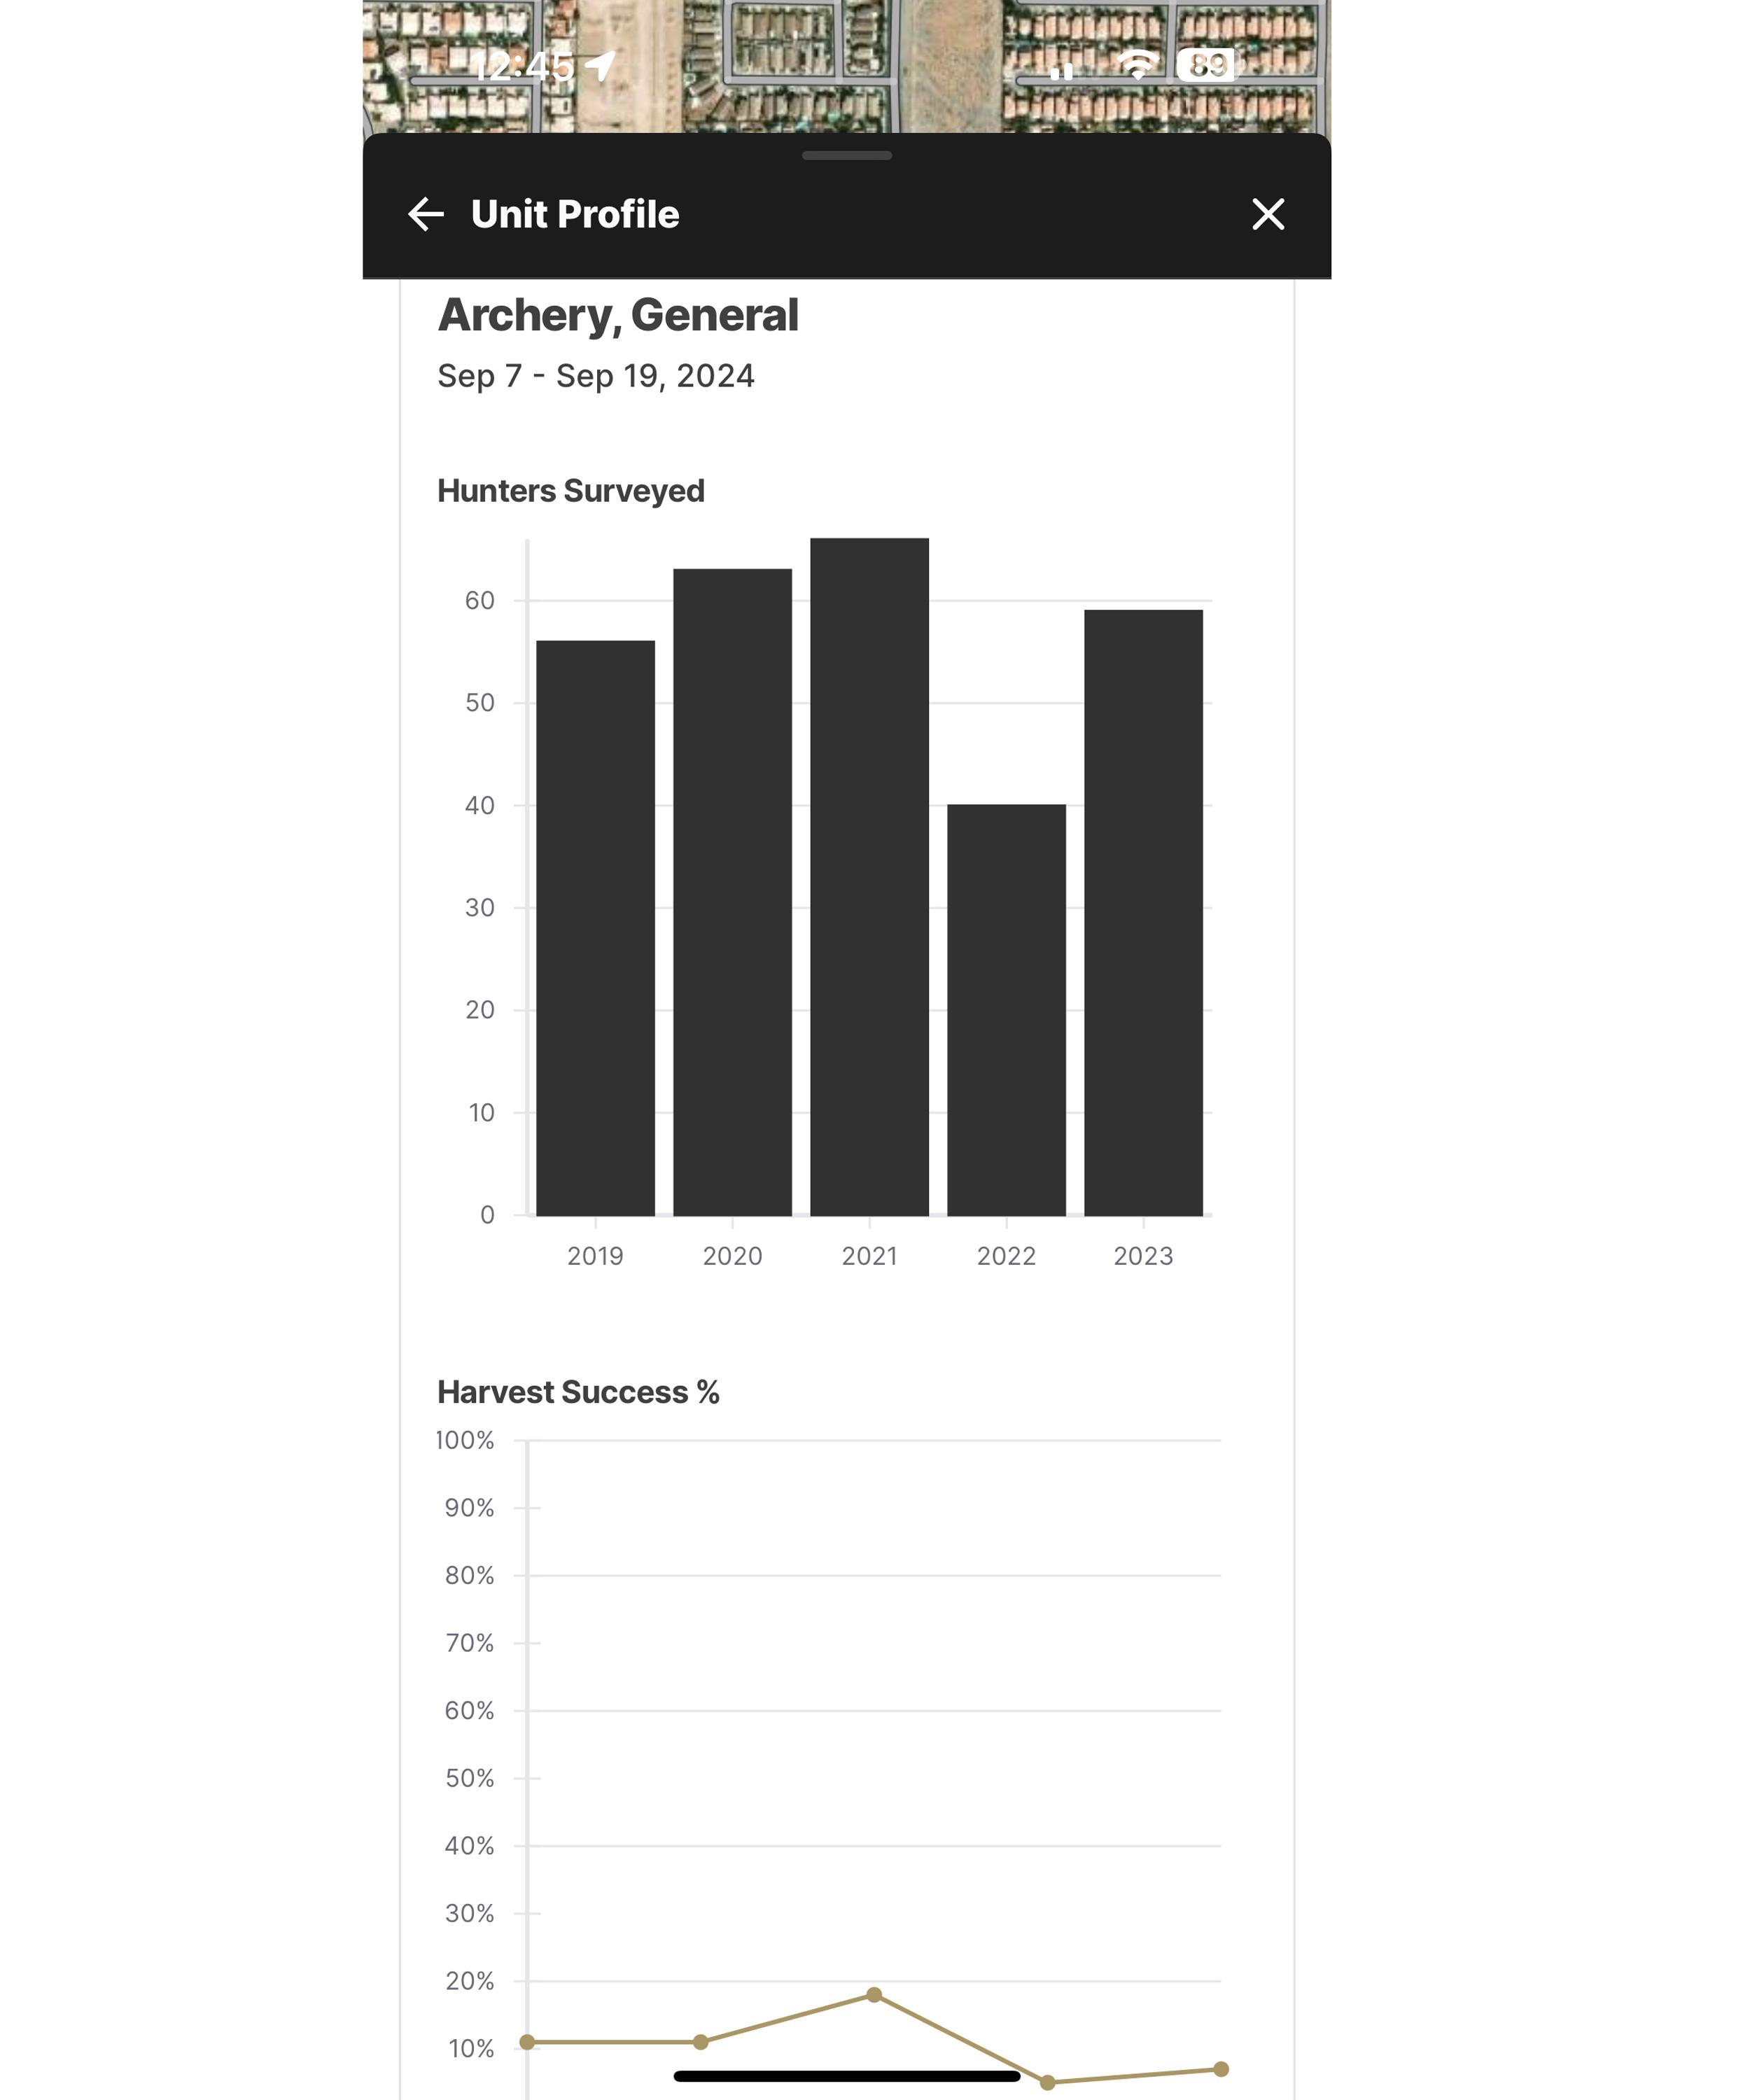


You can see season five-year trends of Hunters Surveyed and Harvest Success for every over-the-counter season in a unit.

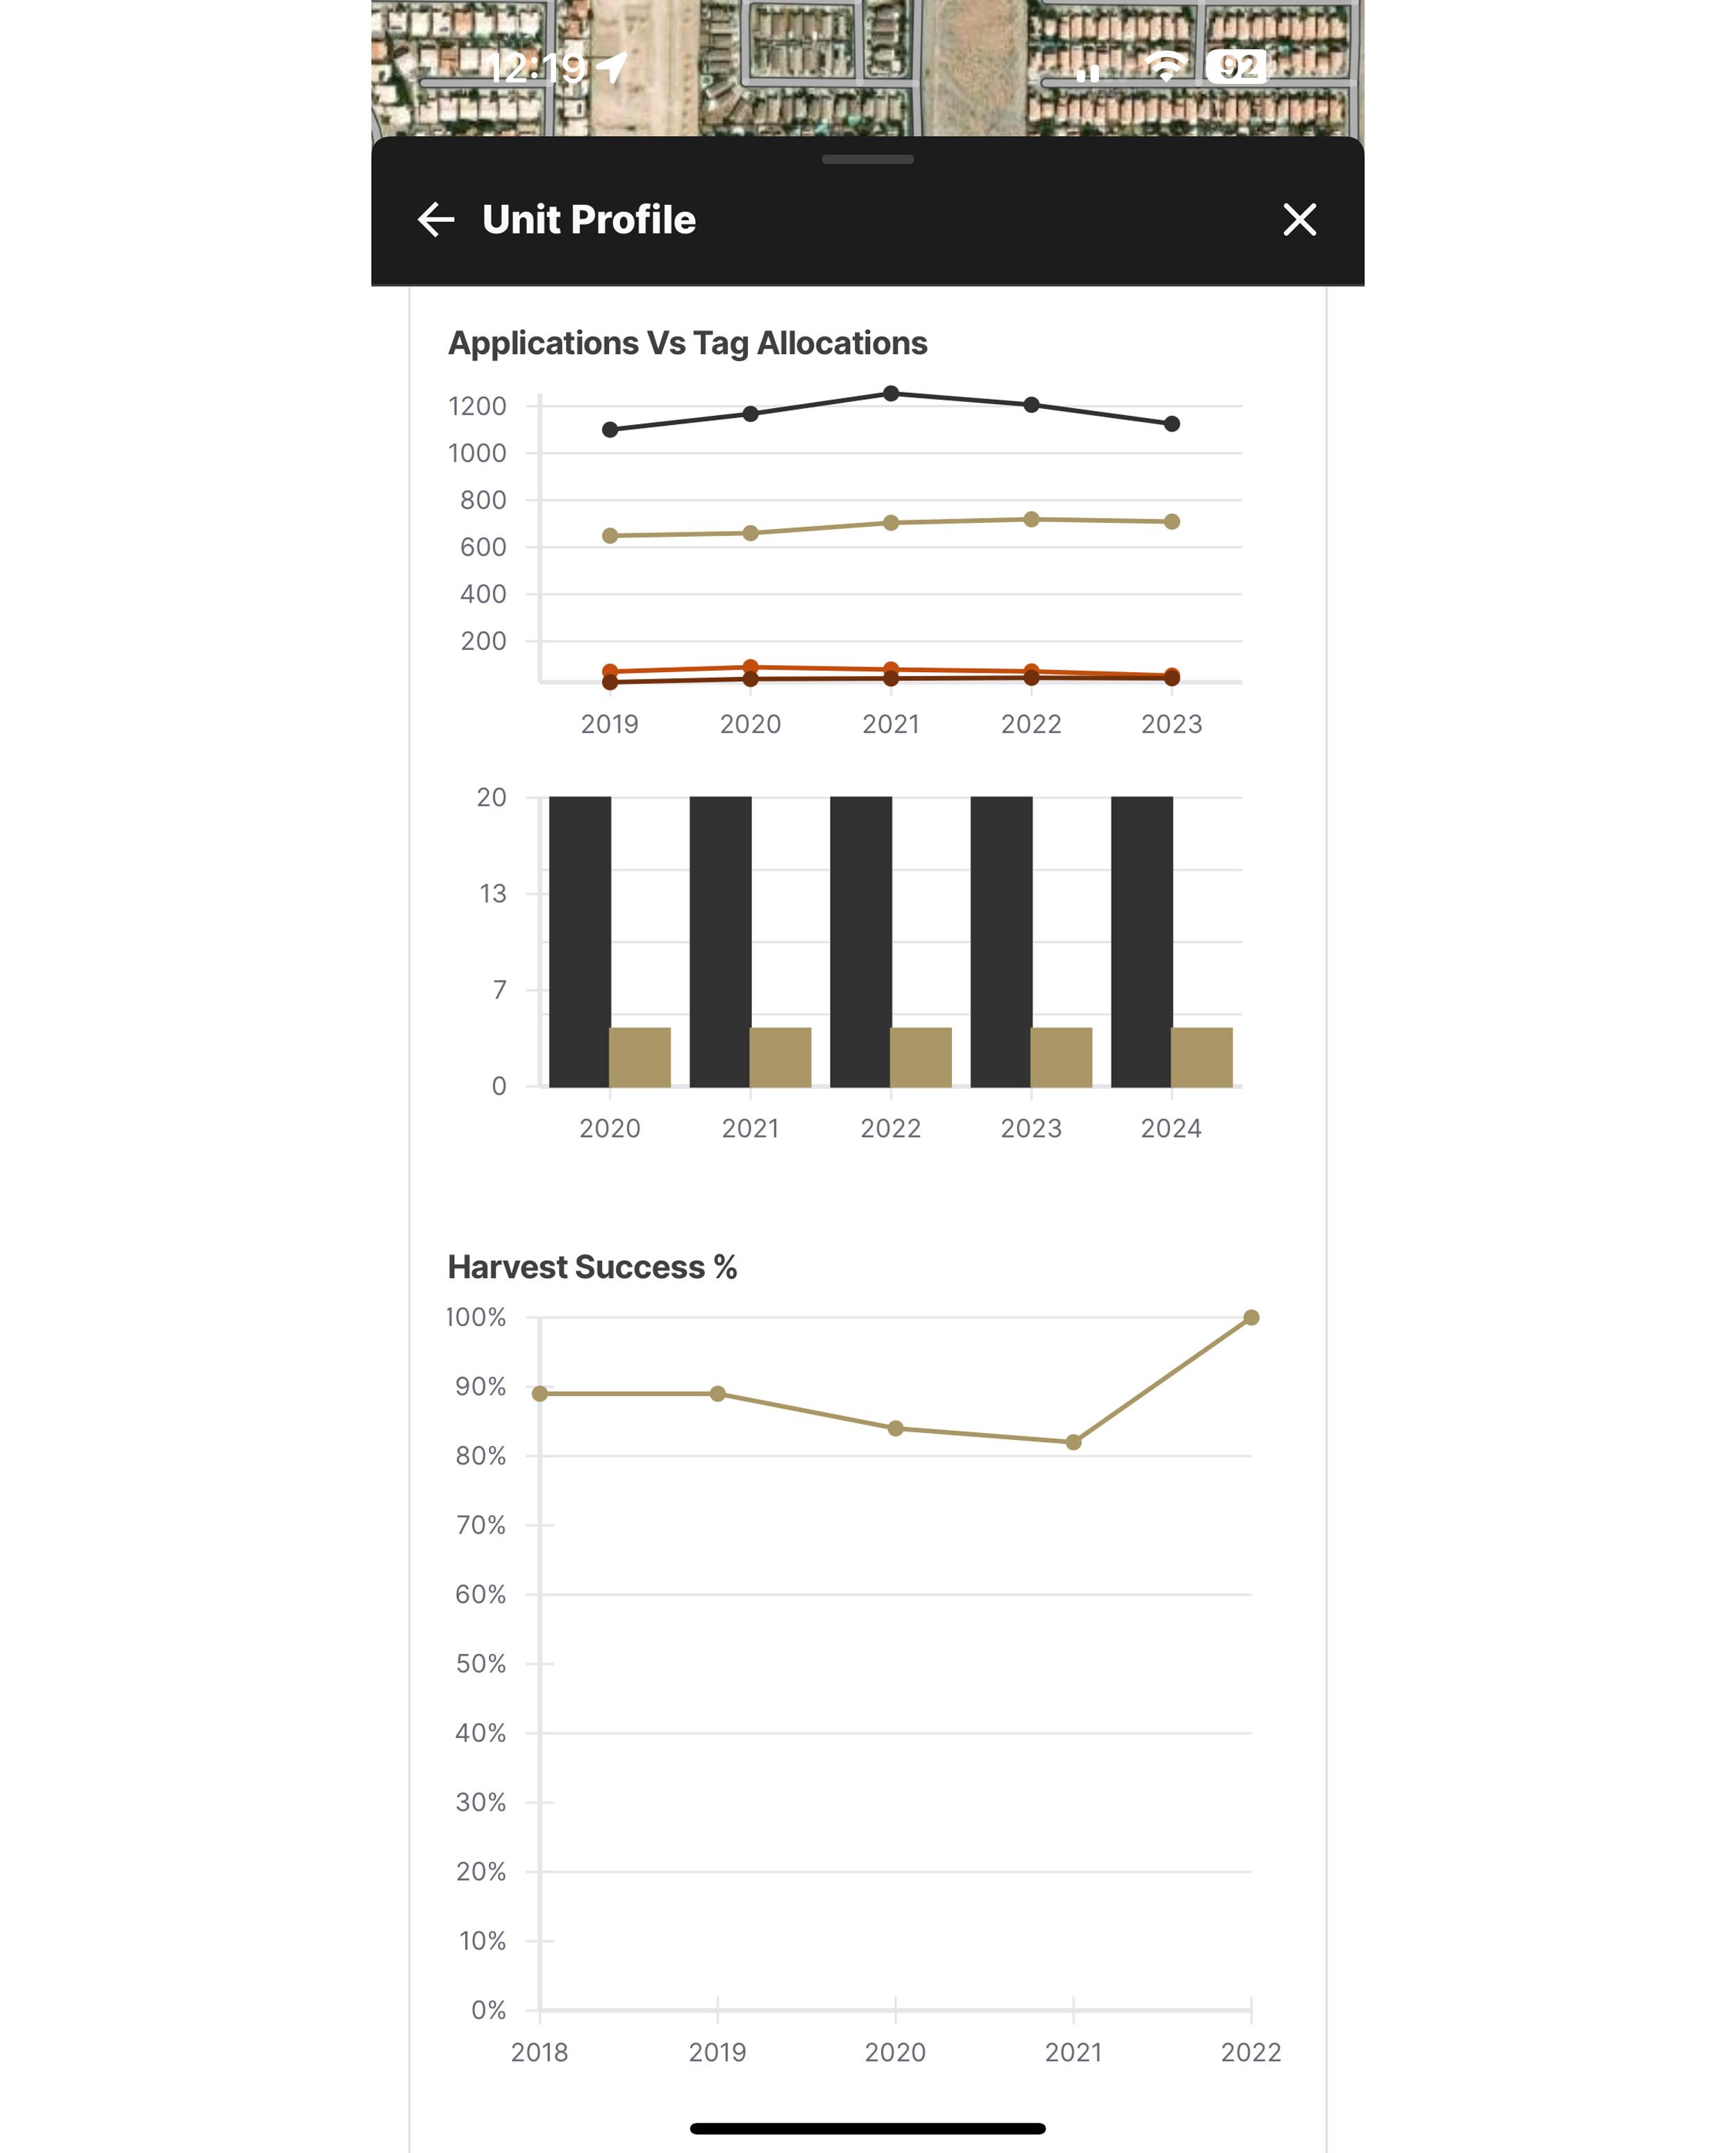
You can quickly see five-year trends of applications, tag allocation, and harvest success data on Unit Profiles when researching for draw hunts.
We’ve added a new feature to the GOHUNT app and we are beyond excited to share it with our customers. Unit Profiles is now available in the app, and it’s another amazing tool for you to use when you research future hunts. This tool has been around since the start of Insider on our web platform, but it’s the first time that you’ll have it available to you on your phone with the mobile app.
In this article, I want to discuss the 5-year trending data and why it’s one of the biggest advantages to the Unit Profiles. I’d also like to explain how this mountain of data can benefit you in planning for future hunts.
If you need a walk-through on how to access Unit Profiles in our mobile app, be sure to check out the article here.
Each Unit Profile is loaded with 5-year trending data to help you when it comes to hunting research. This includes hunters surveyed, tag allocation, total number of applicants, harvest data, and draw odds. Most of this data is found about midway through the Unit Profile and it’s listed for each of the available seasons for that specific unit. The reason it’s important to look at data over a 5-year span is because it helps you predict what the upcoming season or draw will look like for that unit. When looking at data over a period of time, you want to look for patterns. You’ll see upward trends or downward trends, and this can help you sort through which unit or region is best. Analyzing this data is beneficial for those who are looking for over-the-counter hunts and for those who are looking for draw hunts. We will dive into both examples below.
When looking at Unit Profiles for an over-the-counter hunt, you will see “Hunters Surveyed” and “Harvest Success” charts. This basically tells you how many hunters were in the field and what the percent of kill it was. Different states have more accurate data than others, but it’s pretty close to the actual. If you see 5 years' worth of very few hunters in the field and 5 years worth of decent to good harvest success, then that’s probably a unit worth paying attention to. The same goes for the opposite scenario. If there are a ton of people hunting and absolutely terrible harvest success, then I would definitely stay away from that unit. If you happen to notice an anomaly in the data or spikes in the data, year over year, there’s generally a reason for it, and you want to look for consistency. The more consistent, the better and this will give you the best guess on what to expect going into the next year.
For draw hunts, the tables will look a little bit different. You’ll see a couple of graphs that show you the number of tags and the number of applications. Both of which are broken down by residency. These tables can show you a couple of things. The main thing is the tag allocations for that unit over the years. This gives you the average number of hunters in the field and a look into the overall herd health for the unit. Generally, the harvest success will mirror any and all tag changes. If tags stay the same or increase over the years, that tells you that the populations are in good shape. When you see a steady decline in tag numbers, that’s never a good sign.
You can use this data to help predict what most folks will do when it comes time to apply. If tag numbers stay the same, then you can expect the same number of applicants. If it's a unit where tags fluctuate up and down year after year, then that makes it extremely difficult to predict. Most of the time, the applicant numbers will mirror the tag allocation, but sometimes they don’t. For the more sought-after units, it’s going to be really hard to predict what will happen. This data is really beneficial for the states that publish the tag allocations prior to the draw. For those that don’t, then it’s a crap shoot. The final thought for draw units is if the tag and application numbers stay consistent over time, you can pair this with your points and odds to predict whether you will draw or predict potential point creep.
So, to sum all of this up, each Unit Profile is filled with a pile of data that is unit-specific for each state. This data has always been available on our web application, but it is now readily available to you through the GOHUNT mobile app. All this data now lies within the palm of your hand and can be accessed anywhere when you’re in the mood for researching. Here is where you will find these 5-year trends, and you want to look for consistency or patterns to help predict the best outcome. Draw units might show some inconsistencies, but combining the data and the points you have, will help predict how many points it will take and when you might draw. If you’re not yet an Insider, there’s no better time to sign up. Download the GOHUNT app and get all of this great data for when you need it.