

With this mule deer map data approach, I'm able to establish a solid research base for why I'm seeing bucks in certain places and not in other areas.
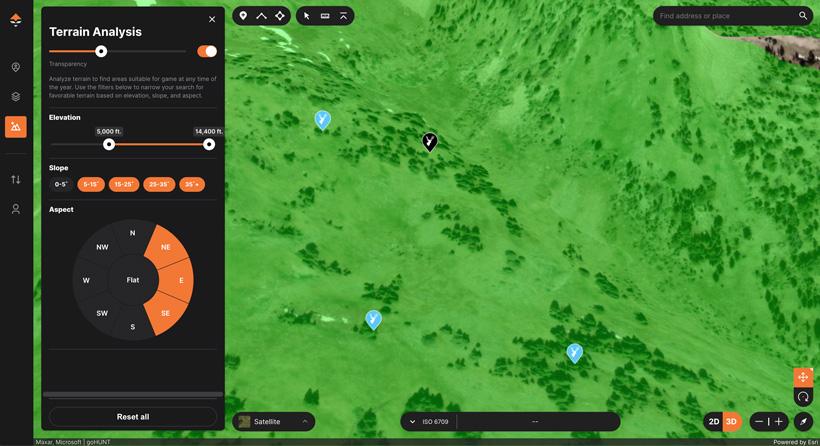
Using the Terrain Analysis Tool to look at hunting waypoint data.
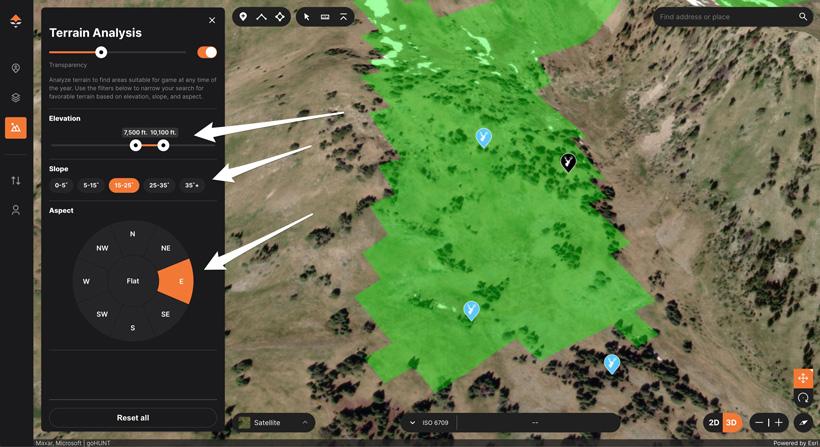
Data analysis from hunting waypoints on mule deer locations and kill locations.
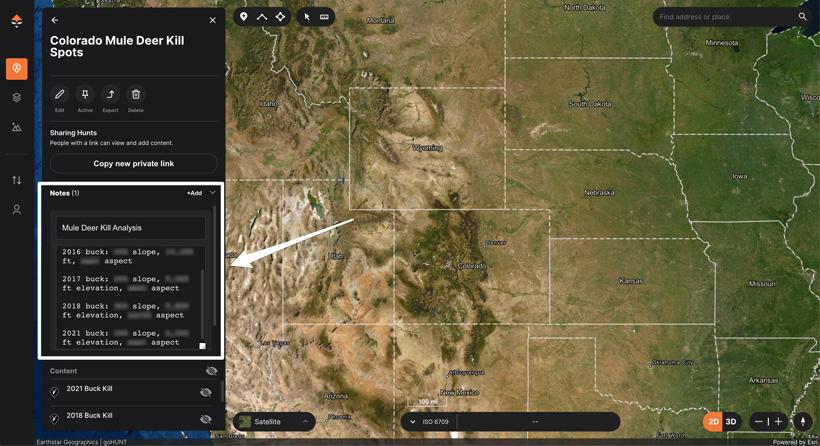
Organizing mule deer harvest locations and adding note data to a Hunt Folder.
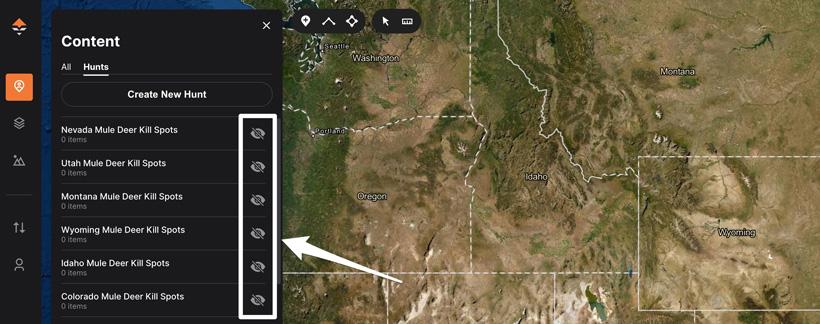
Organizing mule deer kill locations by each state.
When looking at a map, which parts are most important and how do I determine where mule deer will be? That is the first step toward success in my opinion. Luckily I don't have to go into a hunt blind and can use certain tools on GOHUNT Maps to point me in the right direction.
Alright… what I’m about to talk about is a super in-depth method on how I use one of my single favorite features we have ever launched to GOHUNT Maps. As you saw in our 2022 release, our new Terrain Analysis Tool changes the game in e-scouting! Luckily I've been using this tool for a while now, and now I want to share one of my methods.
What I’m going to showcase in this article is how I’ve been using this tool for some “data analysis” for mule deer. This use case might not seem obvious at first. But hopefully, by the time you finish this article, you’ll have some ideas on how you can use a similar tactic for not only mule deer, but other species as well.
In its simple form, the Terrain Analysis Tool allows you to see more details on a map when you are e-scouting. Now, you can hone in on areas where animals typically spend their day by highlighting areas on a map based on Aspect, Slope, and Elevation. The big plus, you can do all of this in 3D.
Currently, the Terrain Analysis Tool is only available on the web version of GOHUNT Maps.
For starters, I should break down what Aspect, Slope, and Elevation mean when using this tool.
Aspect is the direction the mountain, ridge, hill, etc., faces in a North, South, East, and West fashion. Again, this is very powerful when looking for certain terrain features or locations in a unit you’re e-scouting. Why is aspect important when looking at a map? Animals use different aspects at different times of the year. For example, you might want to key in on south-facing slopes for shed hunting as that is where the snowpack will be less, and animals will be wintering on south-facing slopes. Also, south-facing slopes can be great for spring bear hunting as that is where you might find the first green-up in the spring, and bears will key in on that fresh growth.
If you’re an elk hunter, the north-facing aspect will be your best friend when trying to find benches, water, and bedding areas when you're bowhunting rutting bulls.
Hopefully, you are already thinking about all the great use cases for our Terrain Analysis Tool.
Aspect is broken up into:
Plus, our Terrain Analysis Tool has an additional "Flat" layer that is perfect for identifying benches in the terrain. You can also use the flats layer to find potential spots to pitch a tent.
Note: Multiple aspects (or all) can be selected simultaneously. So you can fully use the tool however you want.
Slope will showcase areas on the map in a range of degrees of steepness in the terrain. Slope is calculated by dividing the vertical change by the horizontal change and is typically represented as a percentage, angle, or ratio. In our case, we use degrees as that the most common use case for hunters.
We break slope into the following degree groups on our maps:
Elevation on a map is simply the height of a particular location above or below sea level, typically measured in feet or meters. Our Terrain Analysis Tool allows you to define a range of elevation between 100 feet and up to 14,400 feet.
I use this feature a lot based on the seasonality of where I have seen animals or expect to see animals depending on the time of year.
One of the biggest features of the Terrain Analysis Tool, in my opinion, is being able to use data you’ve collected on previous hunts or scouting trips to hone in on different areas in that same unit that have similar terrain features. You can also use previous hunt/scout data to help you find mule deer in different states.
This opens the door to finding backup spots or even spots that could hold more mature bucks.
Basically, what I’m accomplishing is extrapolating my findings, taking my results and applying them to other places in a unit, and possibly even expanding my findings to other states.
Maybe there is certain vegetation, cover types, or water in the areas where I see bucks, and that is why they are holding and spending certain weeks or months of their life in those places.
With that data, I’ve even been able to apply the knowledge I learned in one unit and transfer that information to a different unit and even a different state. Yes, not everything you see in one spot means there will be animals in another part of the unit with the same terrain. But this gives me a phenomenal starting point when honing in on areas I want to hunt mature mule deer based on areas I’ve found bucks in the past. You never know, this research could even lead you to a better spot in the place you have been hunting for years.
What I’m trying to hone in on is the why. Why is that particular mule deer on that slope and at that elevation during that particular time of year? Are there patterns to the mule deer I’m hunting in certain units?
When I’m hunting or on scouting trips, I enter a ton of waypoints on my mobile app! If I’m in the field, I always feel like my time is best spent learning the unit and collecting data on what I’m seeing. And the easiest way to do that is by marking many waypoints. After all, that is data that I can use later on a hunt or when I’m back at my computer researching and analyzing my data to find trends… hence the data analysis part we are talking about.
If you need a refresher, I highly suggest you read the article "How to organize your hunting waypoints — set icons, and color code your content" by checking out the link below. This article goes in-depth on how I organize and color code my waypoints while in the field.
For example, when hunting or in the field scouting, I will mark a waypoint for every mule deer buck I see. Then, in the notes section of that waypoint on the GOHUNT Maps mobile app, I will write down what time I see that deer and even what time that deer might head into the timber to bed.
Again, I'm trying to build a data set from which I can use data from previous hunts to help hone in on new areas or find better spots in the unit I routinely hunt that could hold big deer.
One of the easiest ways to get a handle on this “data” approach using the Terrain Analysis Tool is to look at places you’ve killed bucks before. To do this, you need the exact kill spot marked as a waypoint. I do this in the field for every animal I take (I even mark where I take the shot), and I color all my animal kill waypoints black. That waypoint color is easy for me to see. If you haven’t done this before, now is the time to go back into your map and mark all your harvest locations over the years.
Once I’ve done that, I can use the Terrain Analysis Tool to note the Aspect, Slope, and Elevation where I took that animal. One way to make this easier is to turn off and on some of the Terrain Analysis Tool features until you narrow down the elevation zone, slope, and aspect, like in the screenshot above.
It will be a little difficult to call this data exact with a sample size of one, but at least it’s a starting point. And if you’re able to hunt this unit or state more often, you will eventually have more data points to go off of. You could now use this information and narrow down the layers on the Terrain Analysis Tool to only show you the elevation, slope, and aspect of those kill spots. It’s best to also note what the satellite imagery looks like.
From here, start scanning around the unit and check out all the ridgelines, pockets, slopes, and hillsides that meet these exact criteria and have similar-looking terrain and vegetation. Then, you can drop additional waypoints in those zones that you might want to explore on a scouting trip or when you head out on a hunt. If you don’t like adding a ton of extra waypoints, you could also draw a polygon around certain zones and color code it a certain way so you know these are areas to look at.
Note: these examples would be way easier to showcase by zooming out on GOHUNT Maps and showing how I use my data with the Terrain Analysis Tool. But to protect areas, I will keep my GOHUNT Maps screen zoomed in, or some information turned off.
I've recently analyzed all my mule deer kills during the months of October and November, and I saw a trend on what elevation, slope degree, and aspect those bucks were killed on. With that data, I’ve now noticed other places in units I hunt regularly or even places I’m considering hunting that I now want to put my eyes on it in the field. And based on this data analysis approach, I can assume it might also hold mule deer bucks.
This data analysis gives me a solid idea and pattern of where bucks might be during a certain time of year based on trends in where I’m routinely killing bucks.
Another way to utilize the Terrain Analysis Tool is to put all my buck kills (or even bucks I've helped other people take) into one "Hunt" folder on GOHUNT Maps for every Western state. I’ve done this exact method on all the states I hunt (again the screenshots are just an example of how you would go about doing this).
The screenshot above shows the following:
This makes a cleaner view, as I can turn off all the other waypoints on the web mapping version and see my kill locations for one state at a time.
Then, I follow the same steps I described above to figure out any trends I’m seeing.
If you're just starting out hunting and don't have a lot of kill locations marked on your maps, another way I use data on previous hunts or scouting trips is by marking a waypoint for all the bucks and even the does I see. I color those waypoints as a light blue color and then select the correct waypoint icon.
Again, this is helping me to crack the why of the mule deer puzzle. Why is a buck or doe in that particular spot on that particular day or week?
For example, if I have a November rut hunt, and over the years I keep seeing doe groups at a certain elevation, slope and aspect. I might be able to use that information to gauge if bucks will pull into those types of areas during the rut. And again, I could extrapolate the data I've collected in a certain state or unit, and possibly be able to use that information for a unit with similar terrain features. For me, this is all about trying to crack the puzzle and find patterns.
The same approach could be used to find areas where summer bachelor groups of bucks like to frequent.
In some of my previous scouting articles, I talked about various types of mule deer zones. It takes a few years to determine where and what terrain types bucks tend to prefer during a specific time of the year across the West. But you can cut your learning curve down if you mark down waypoints (and take photos of the terrain you're hunting) while you're in the field so you can use that data to help you on future hunts.
I like to break down mule deer zones in the following way:
Note: The above zones are just a basic summary. Keep in mind that these elevation zones will greatly vary where you are in the West.
Check out these articles for a refresher:
Most people probably know by now that I come from a biology background. I fully believe in using biology-based information for mule deer research. I lean heavily on biology reports and peer-reviewed published research studies to learn more about the animals I'm hunting.
Research papers can provide a wealth of information, which you can plug into the Terrain Analysis Tool to further enhance your e-scouting and hunting efforts. There are many biology type reports out there based on the vegetation/feeding preferences of mule deer, elevation animals are at during certain times of the year, and even slope degrees certain animals will feed on or even bed on.
If you’re not using maps when you apply for tags, you’re missing out, in my opinion. When using maps, I can get a true feel for the terrain features, even without stepping foot in the unit. Does this unit have the terrain I’m looking for? Does it have the cover and feed, which I believe will hold deer? Where am I expecting pressure from other hunters to be located? So, I’ll also use the Terrain Analysis Tool and other layers with some of the data I talked about earlier to see if it is a unit that is worth burning my points on.
The fun doesn’t stop once you draw a tag! Once you pull a tag, I will run through this entire process to give myself a solid plan and a starting point.
Again, I hope this article helps you think outside the box when you are e-scouting on GOHUNT Maps. As I always say, mule deer hunting is an art, not a science. So keep in mind that weather patterns, drought, pressure, and a plethora of other factors could change where animals are from year to year. The beauty of GOHUNT Maps is that you can use the Terrain Analysis Tool with a combination of all our other layers! The methods described in this article help me find patterns in mule deer behavior that can put me in the right place to locate a mature mule deer buck. So what are you waiting for? Turn on the Terrain Analysis Tool, play around with the new features, and have your best season ever!
This article was originally published on March 23, 2022, and has been updated with more information.
North, Northeast, East, Southeast, South, Southwest, West, Northwest
0-5°
5-15°
15-25°
25-35°
35°+
Organizing my data; For each state I hunt, I like to create a Hunt folder
I name each Hunt folder in a way I can easily tell what I'm looking at (I have a lot of Hunt Folders)
Then, I can turn off and on each folder depending on what state I want to look at buck kill locations for
Summer alpine zone - 10,000 to 13,000 feet
Subalpine zone - 9,000 to 11,000 feet
Dark timber, pine, and aspen zone - 7,000 - 11,500 feet
Transitional zone - 6,000 to 9,000 feet
Sagebrush winter range zone 4,000 to 7,000 feet