


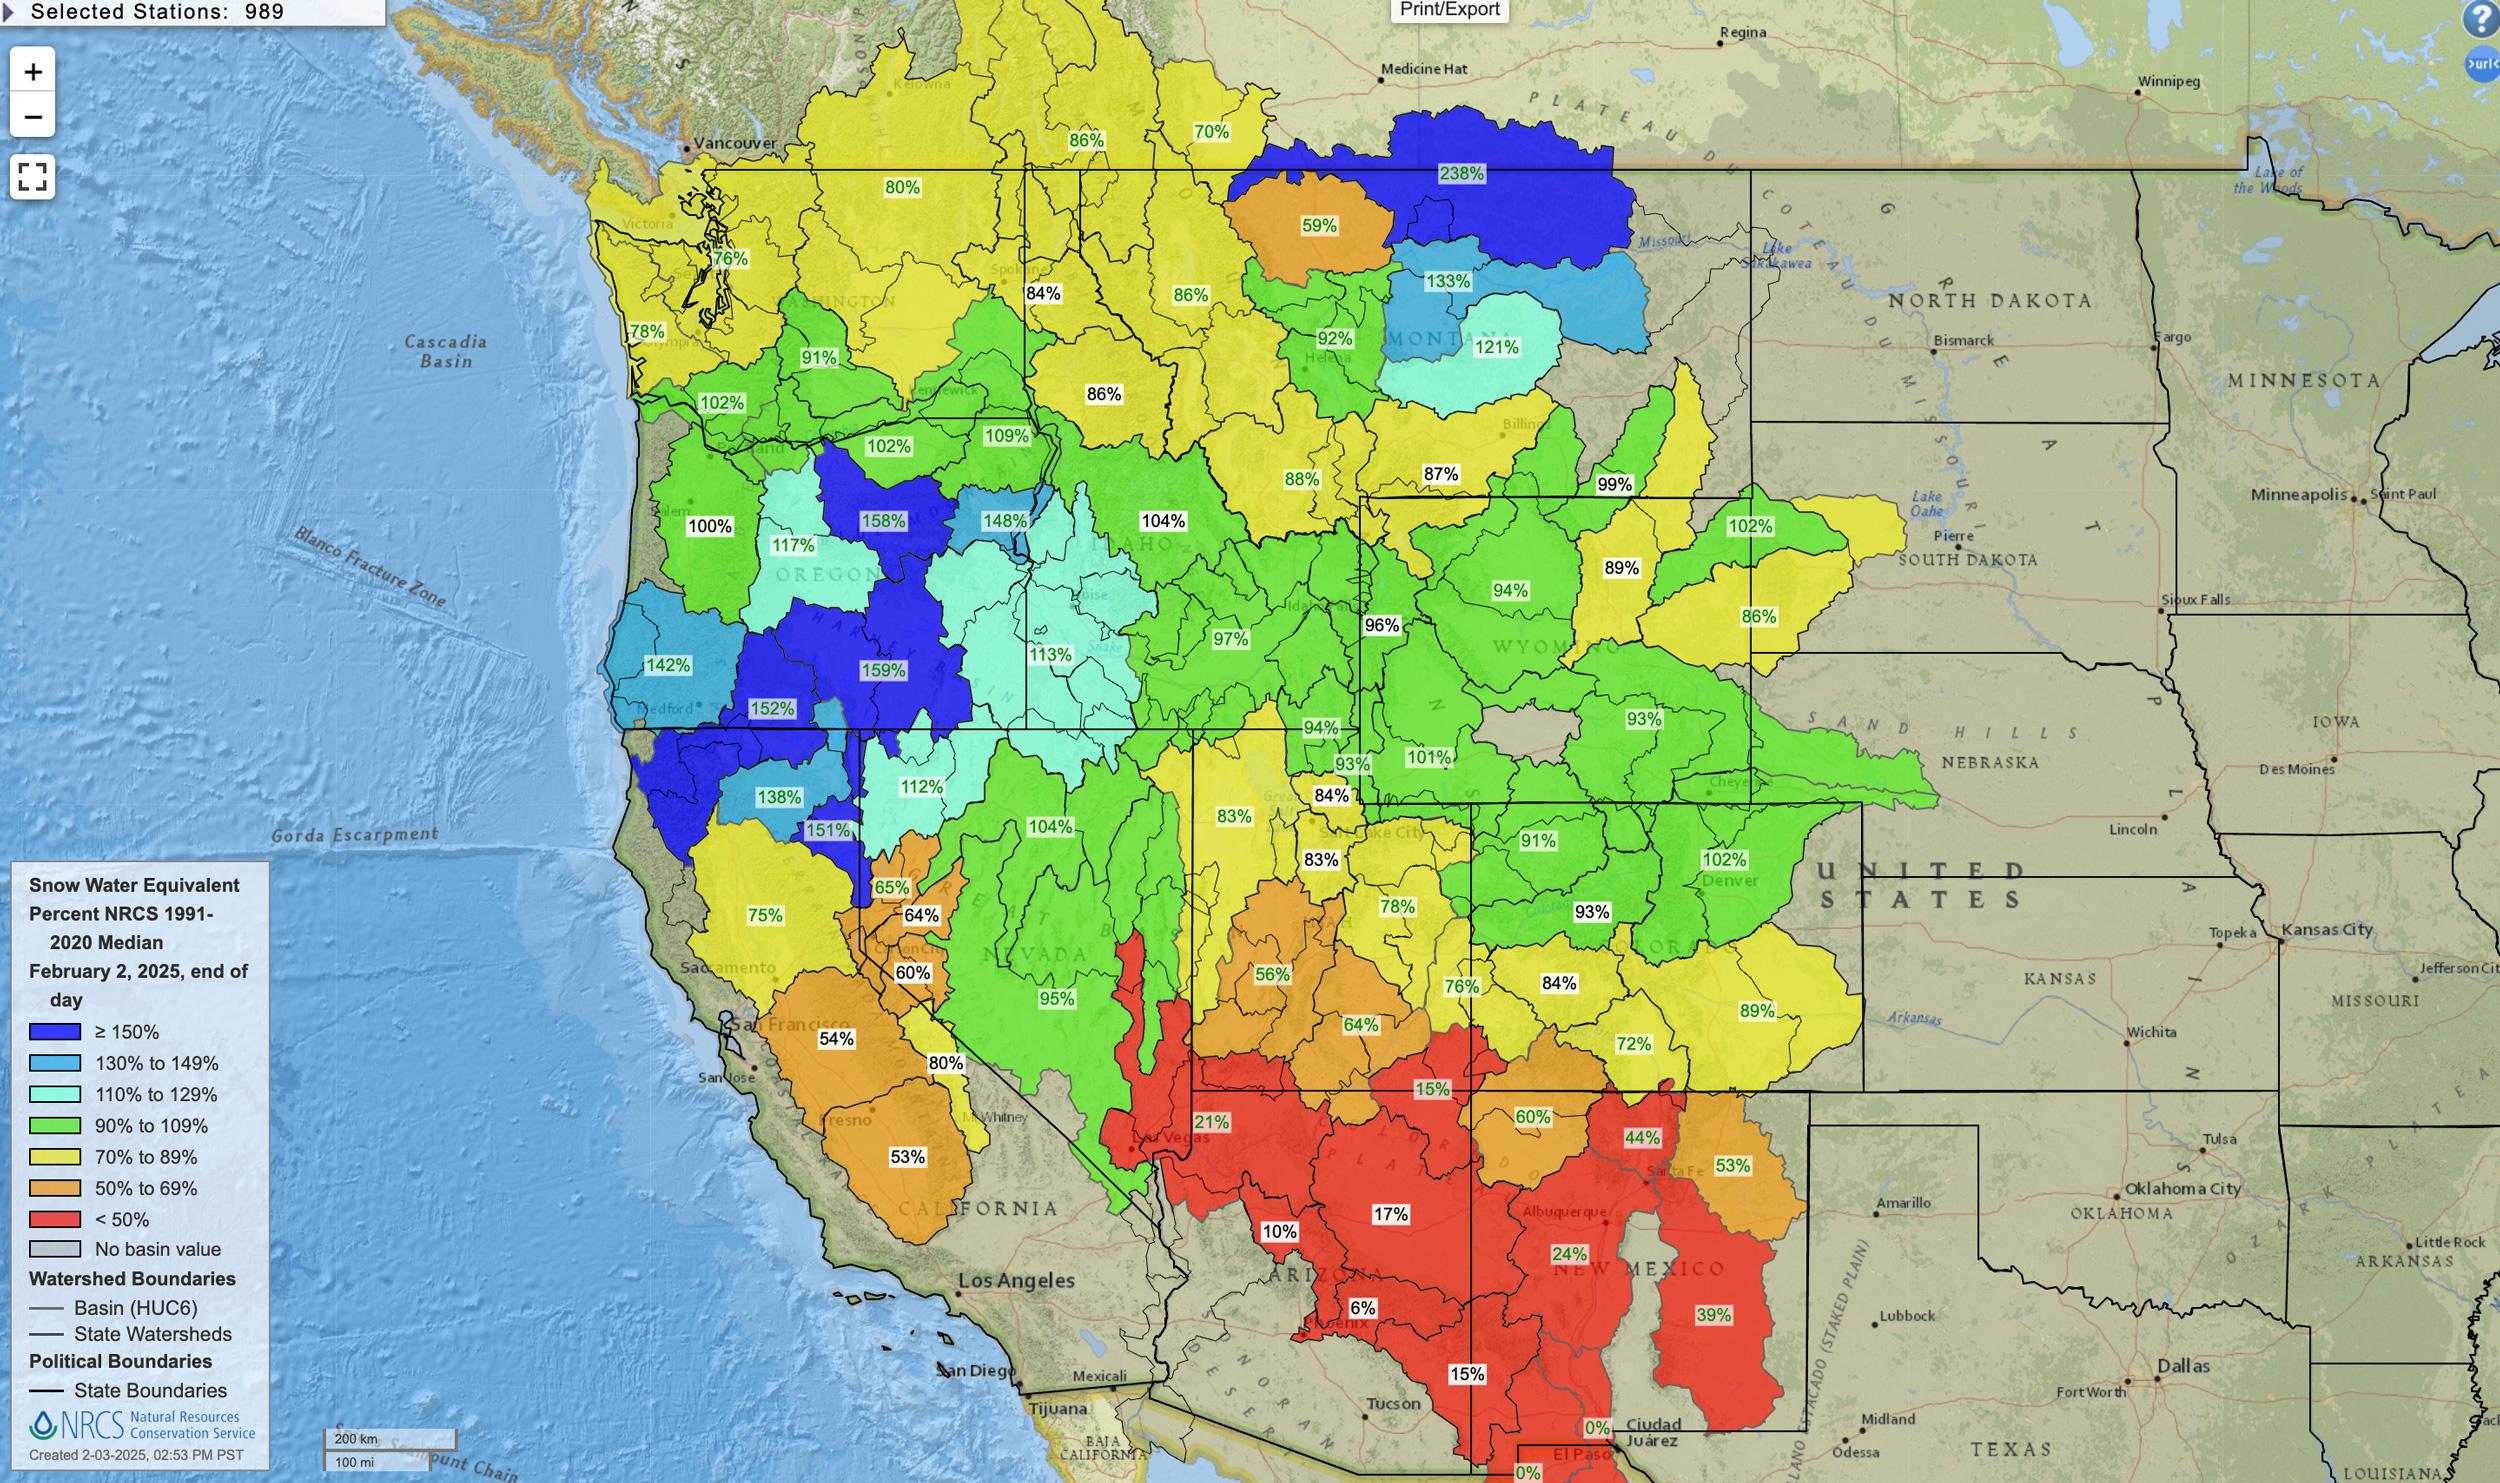
February 2, 2025, Western United States snow water equivalent percent map.
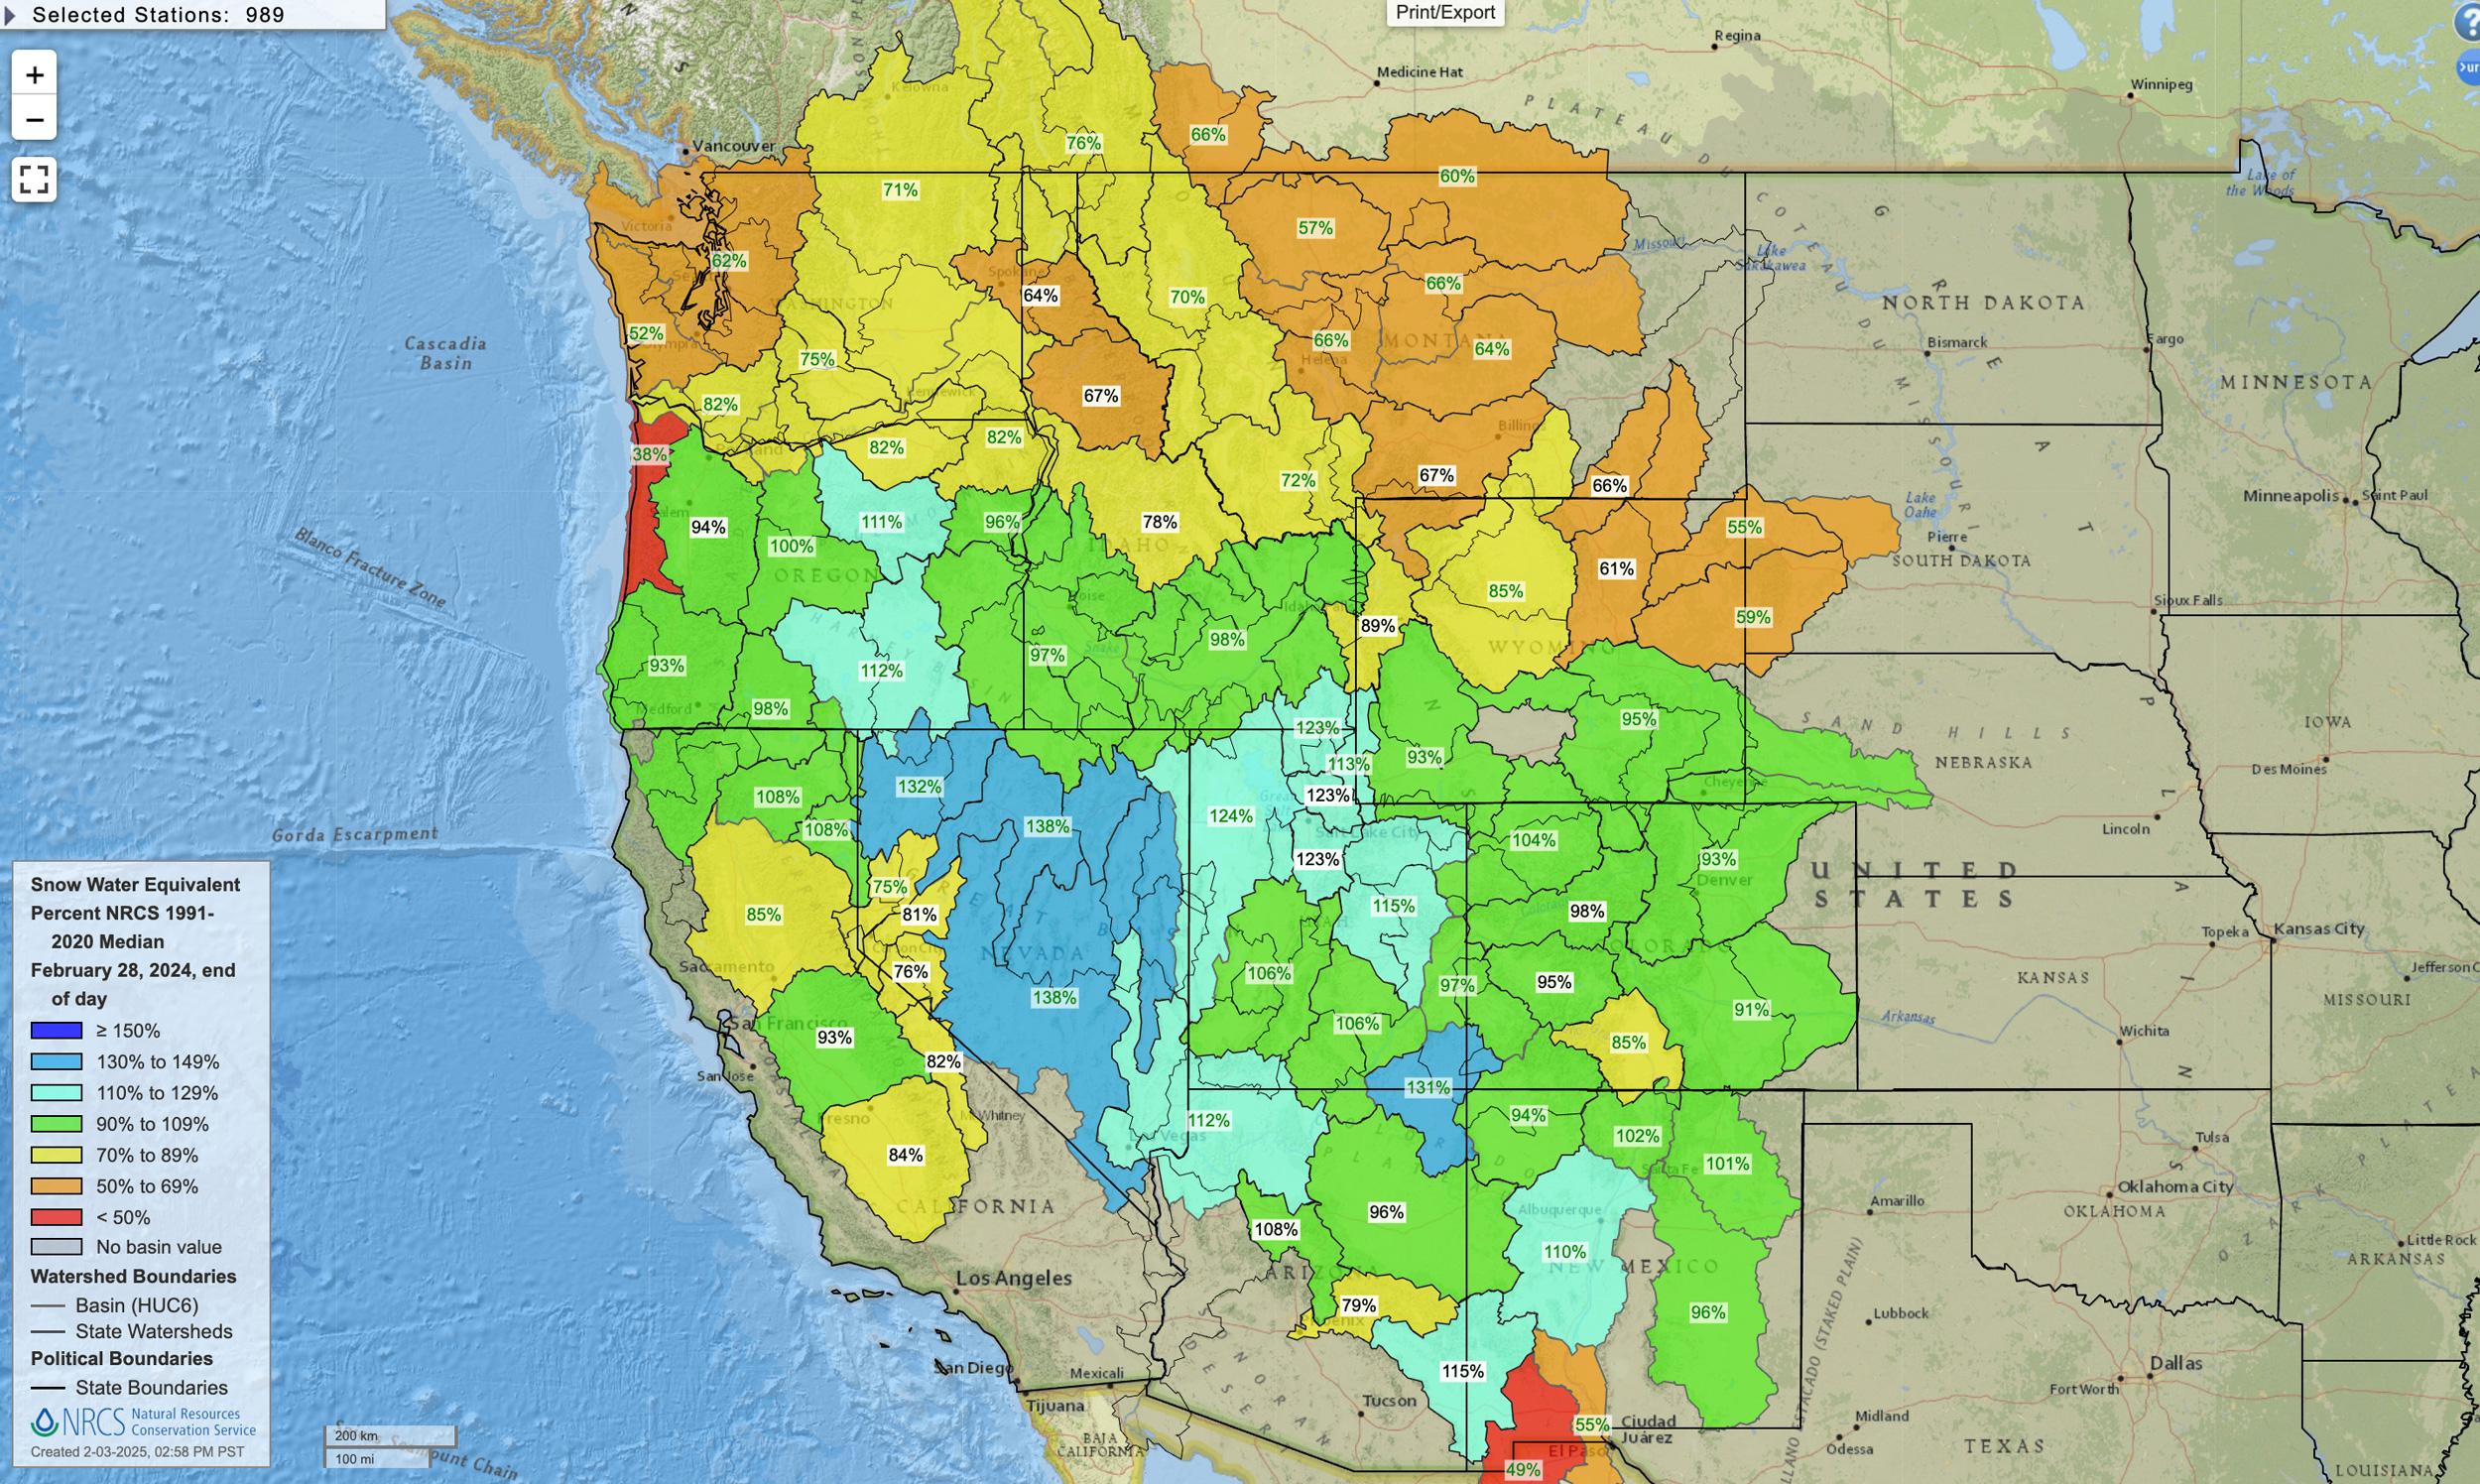
February 28, 2024 Western United States snow water equivalent percent map.
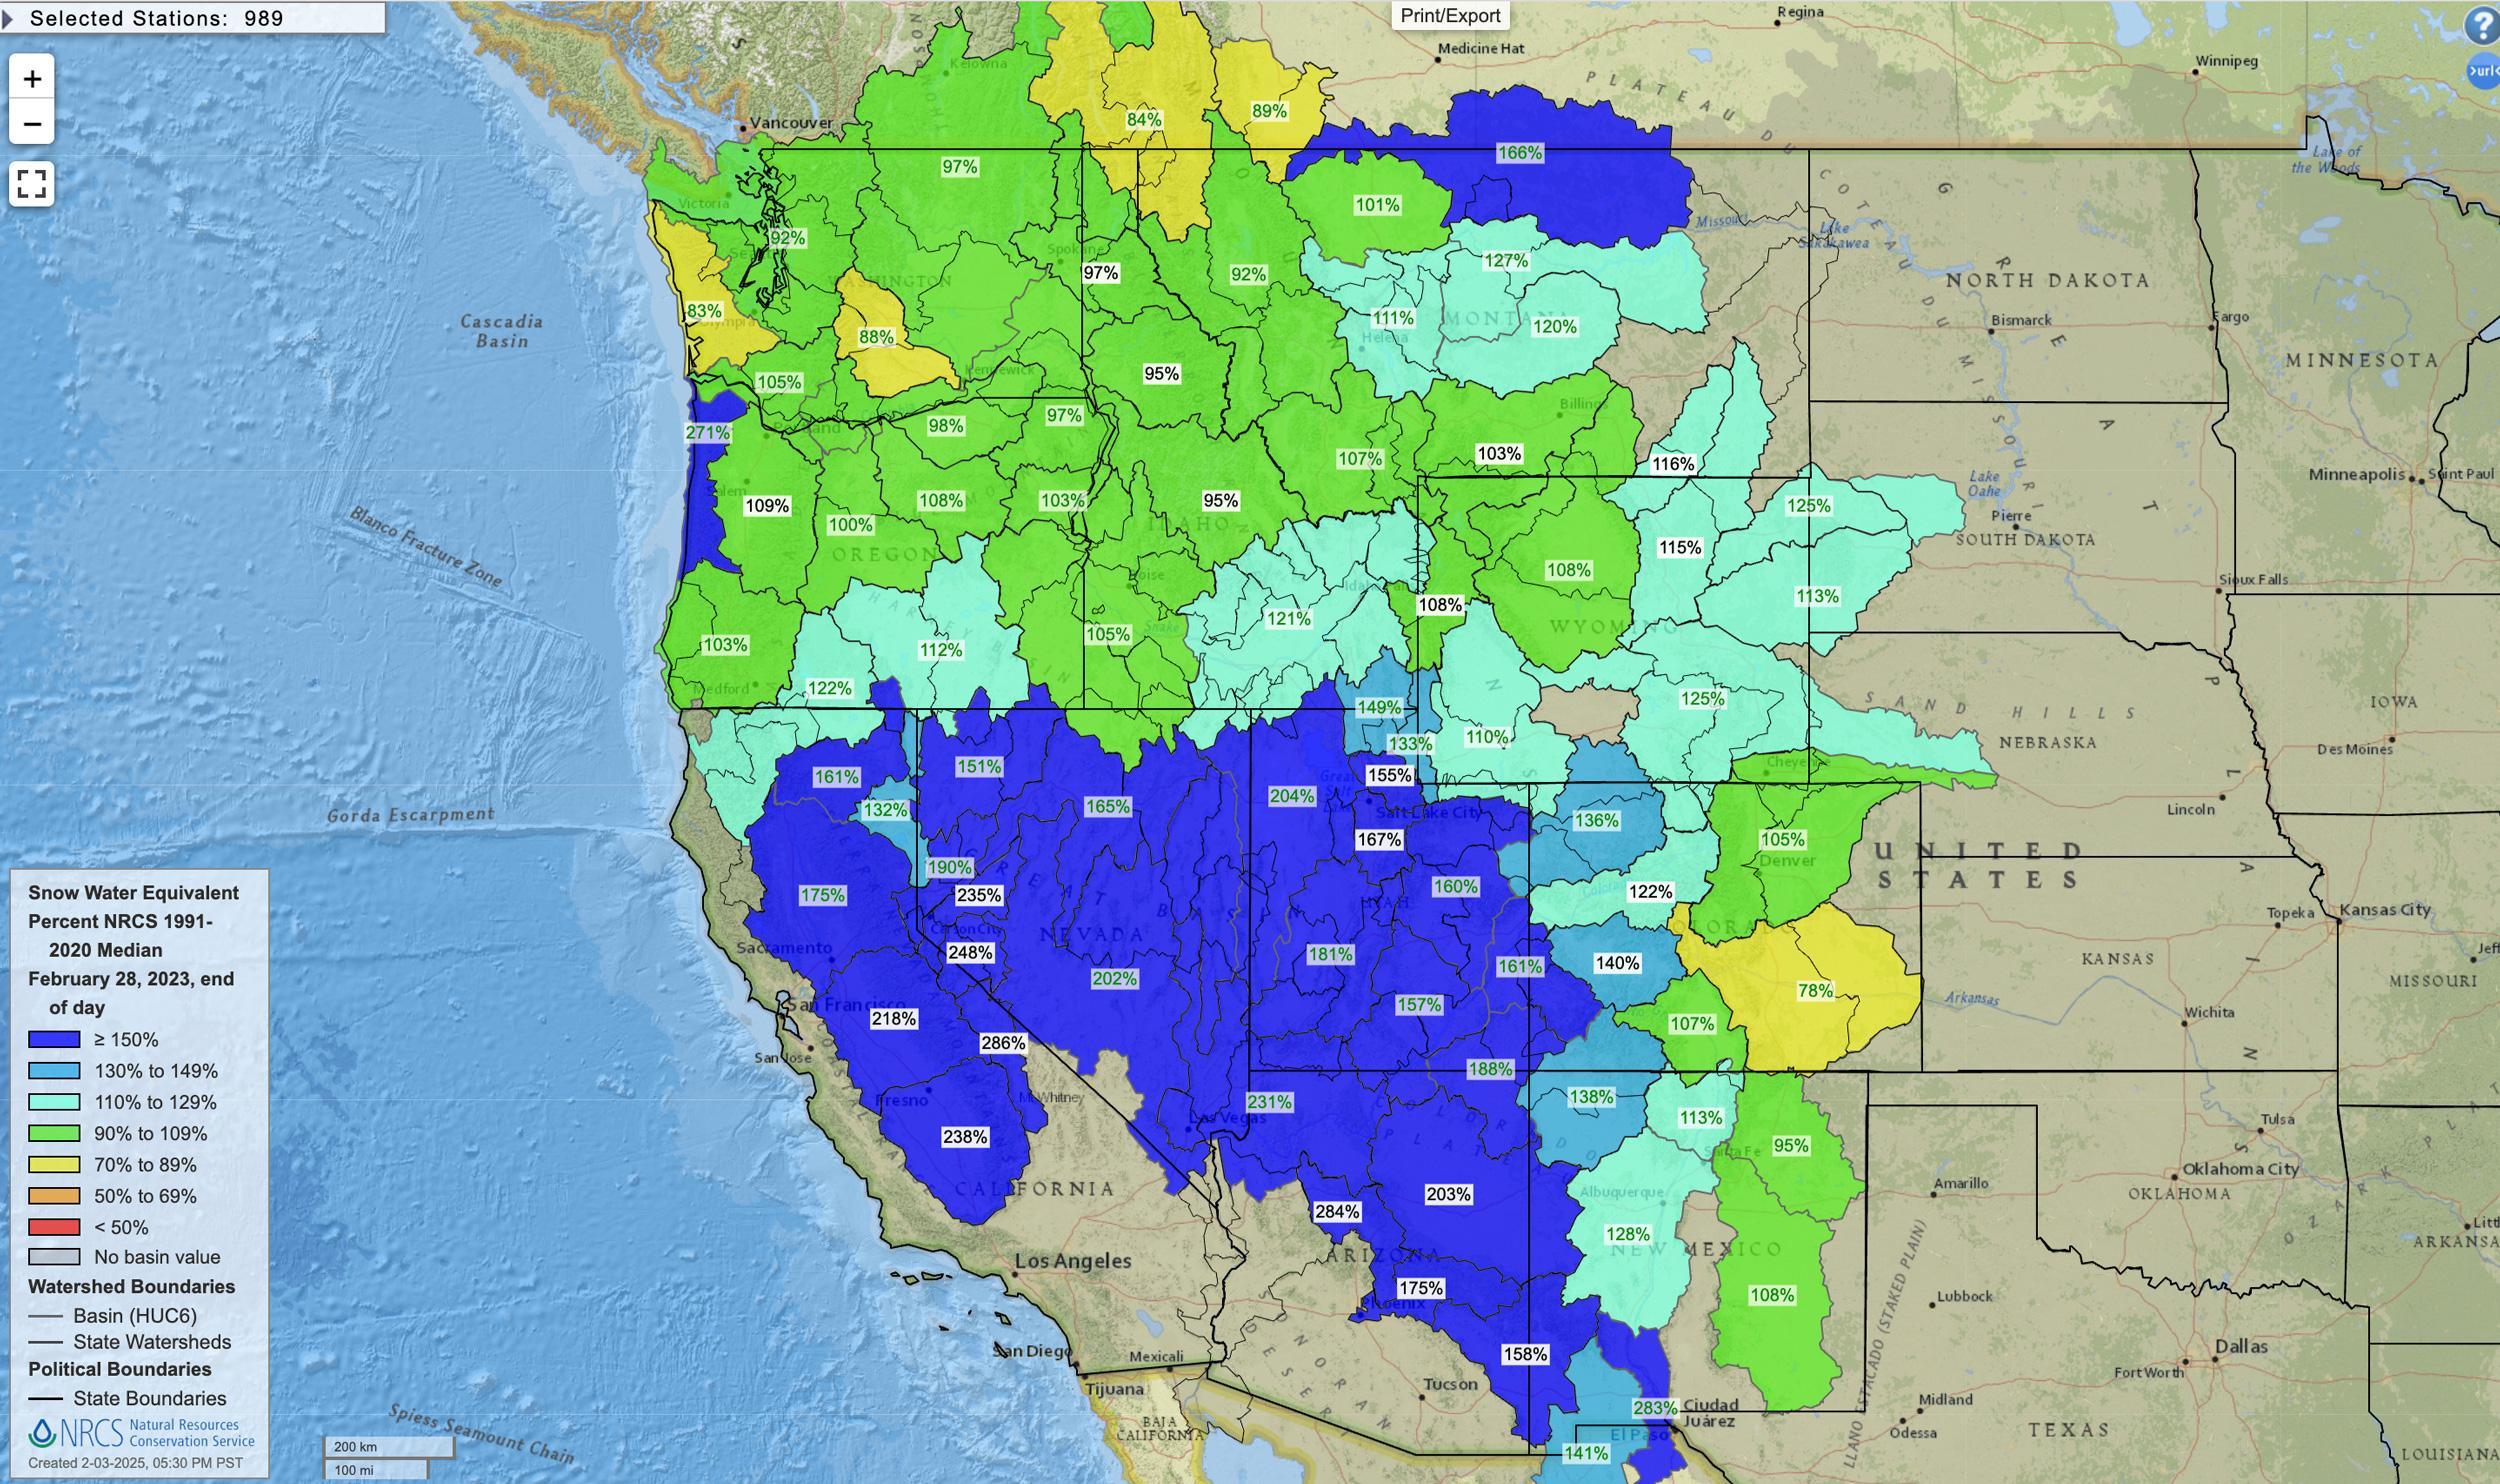
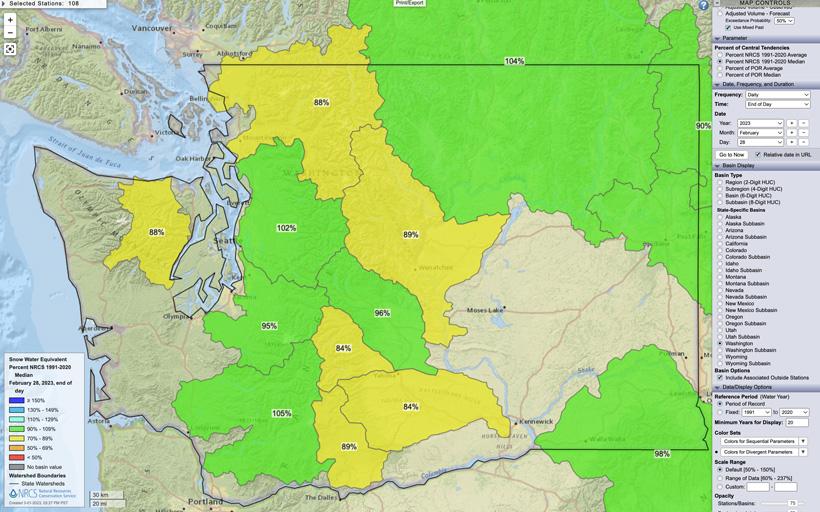
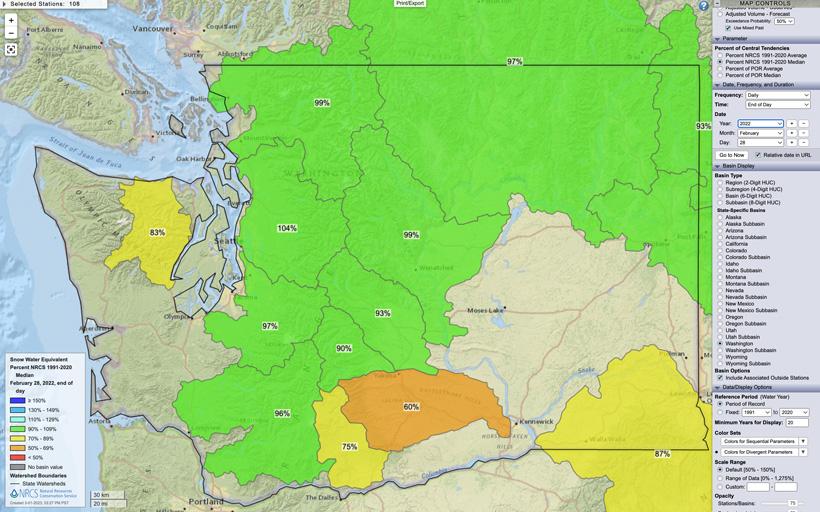
February 28, 2023 Western United States snow water equivalent percent map.
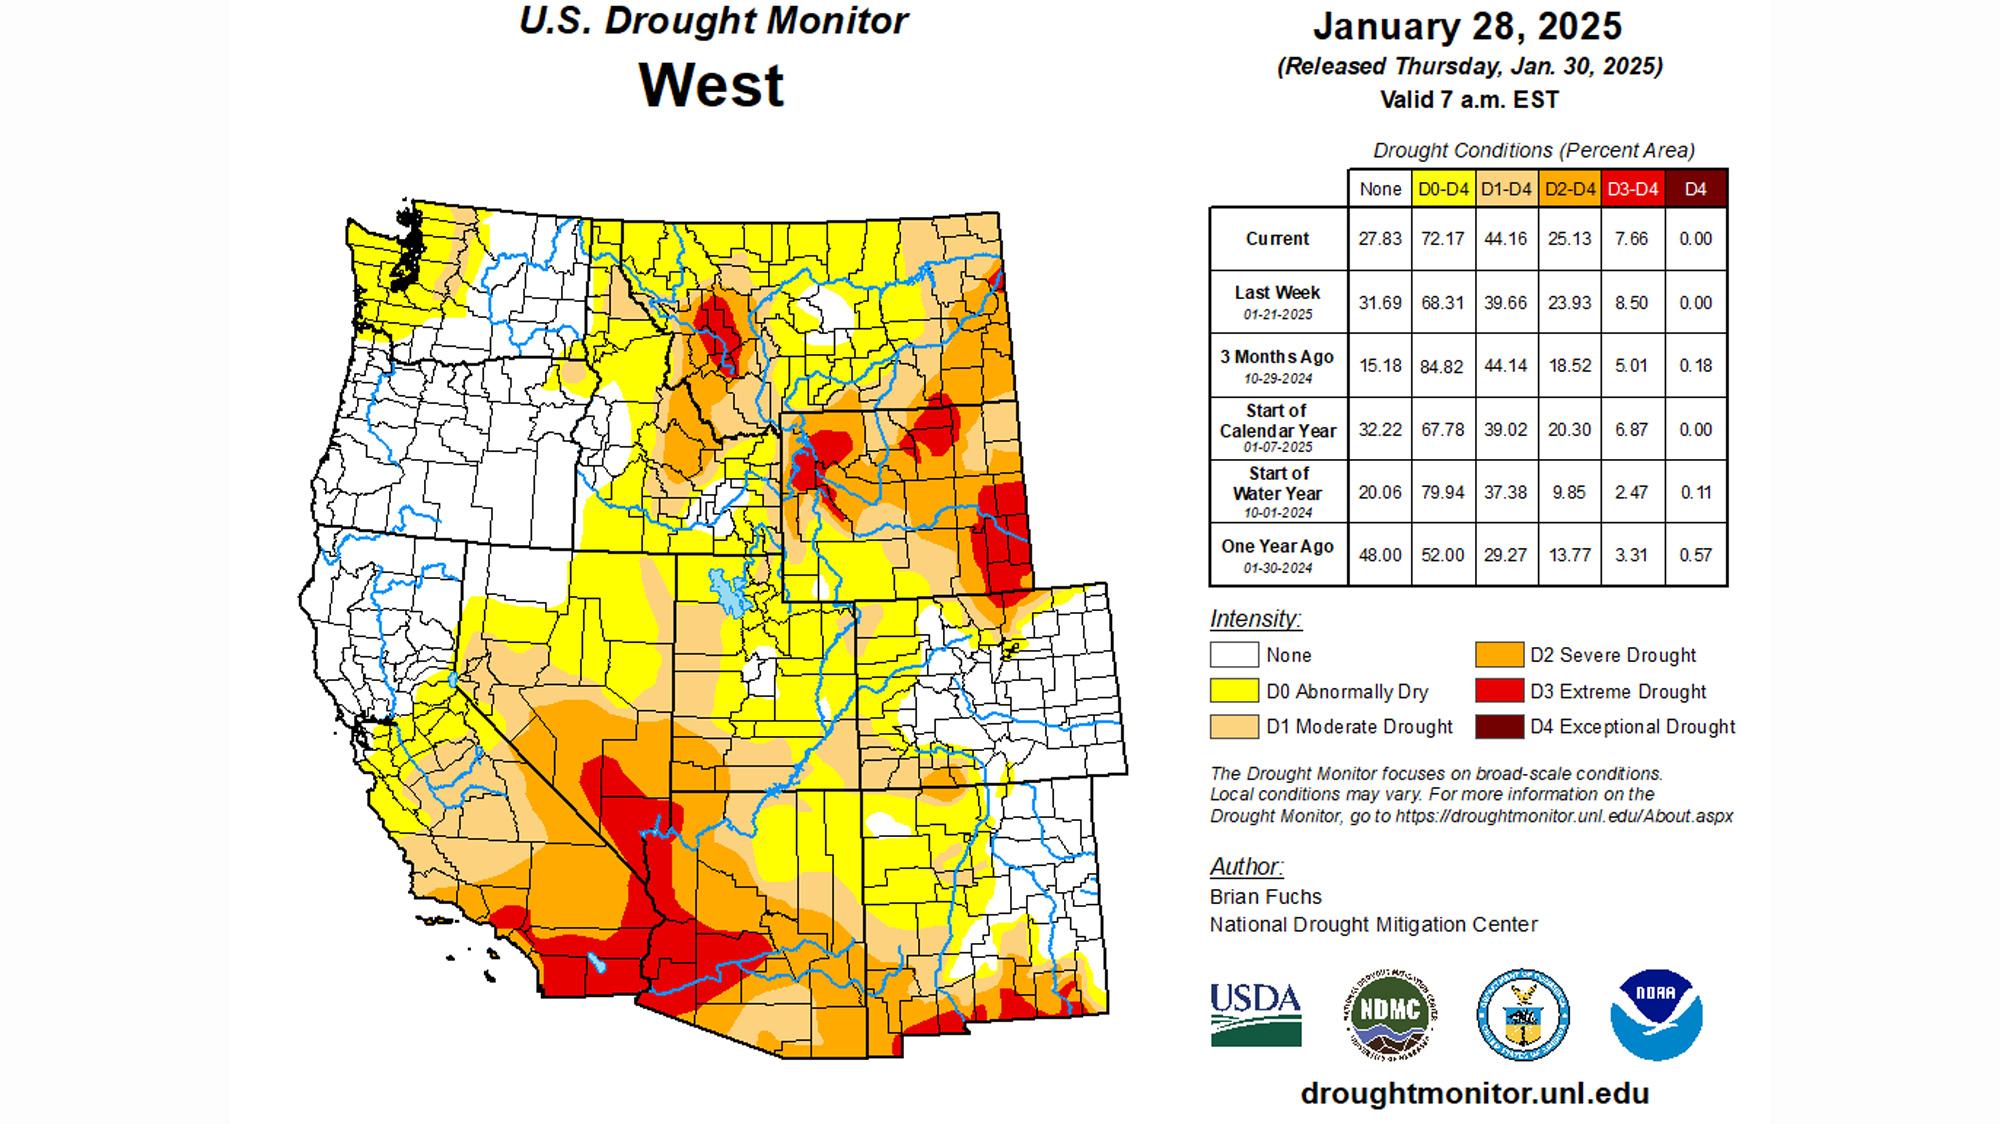
Western United States drought monitor status map late January 2025.
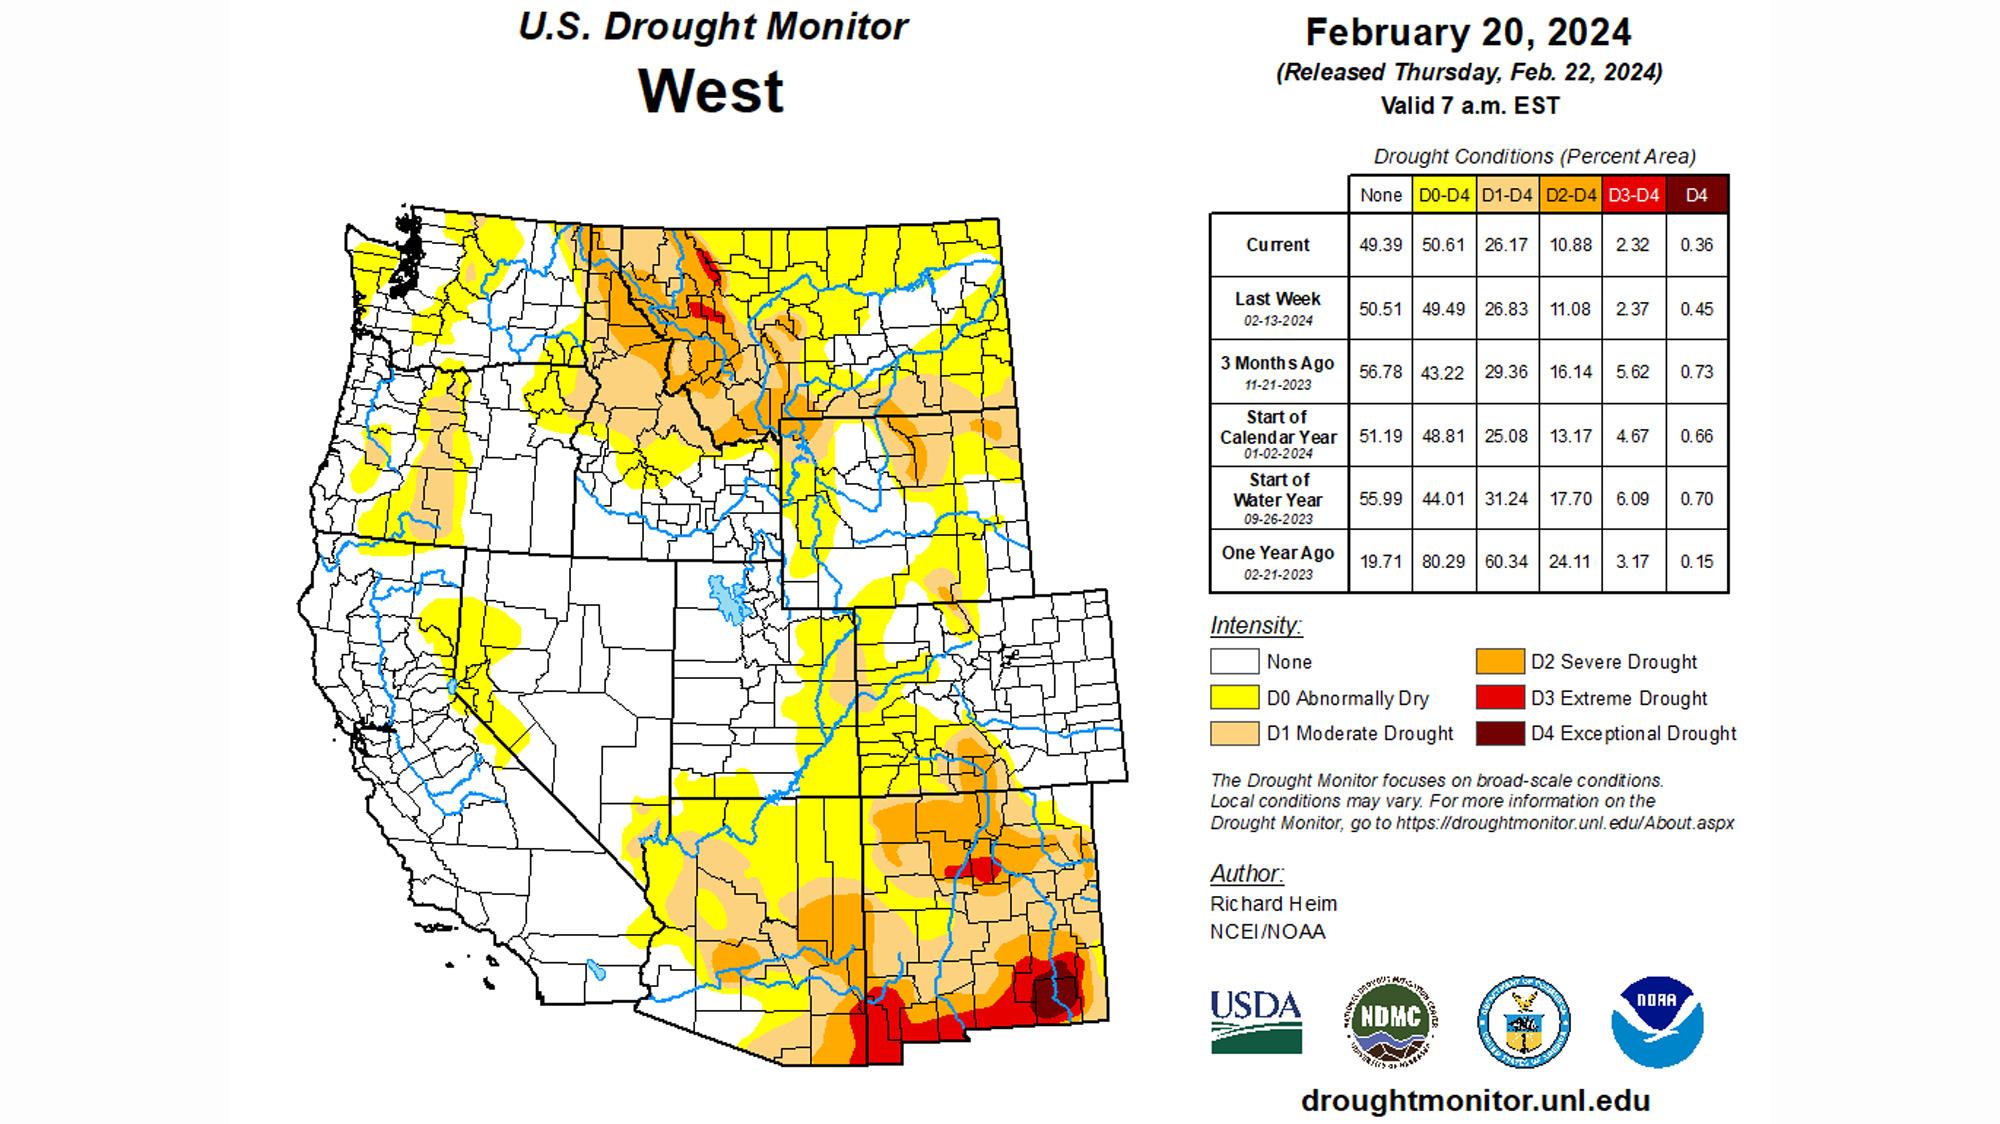
Western United States drought monitor status map February 20, 2024
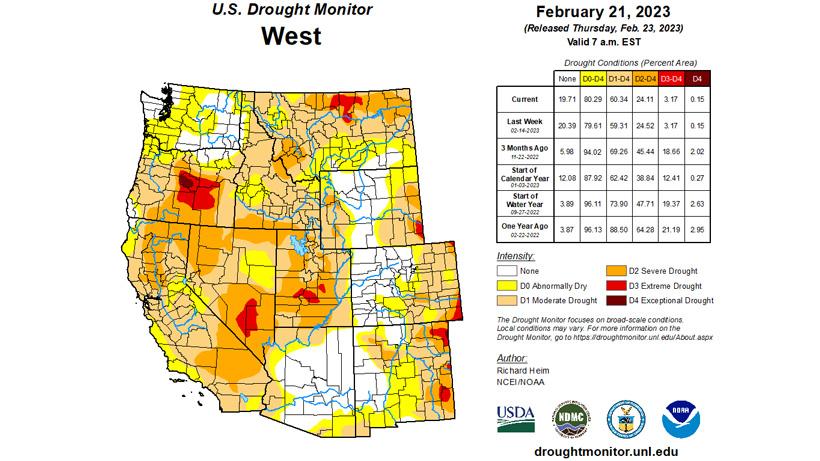
Western United States drought status as of February 21, 2023.
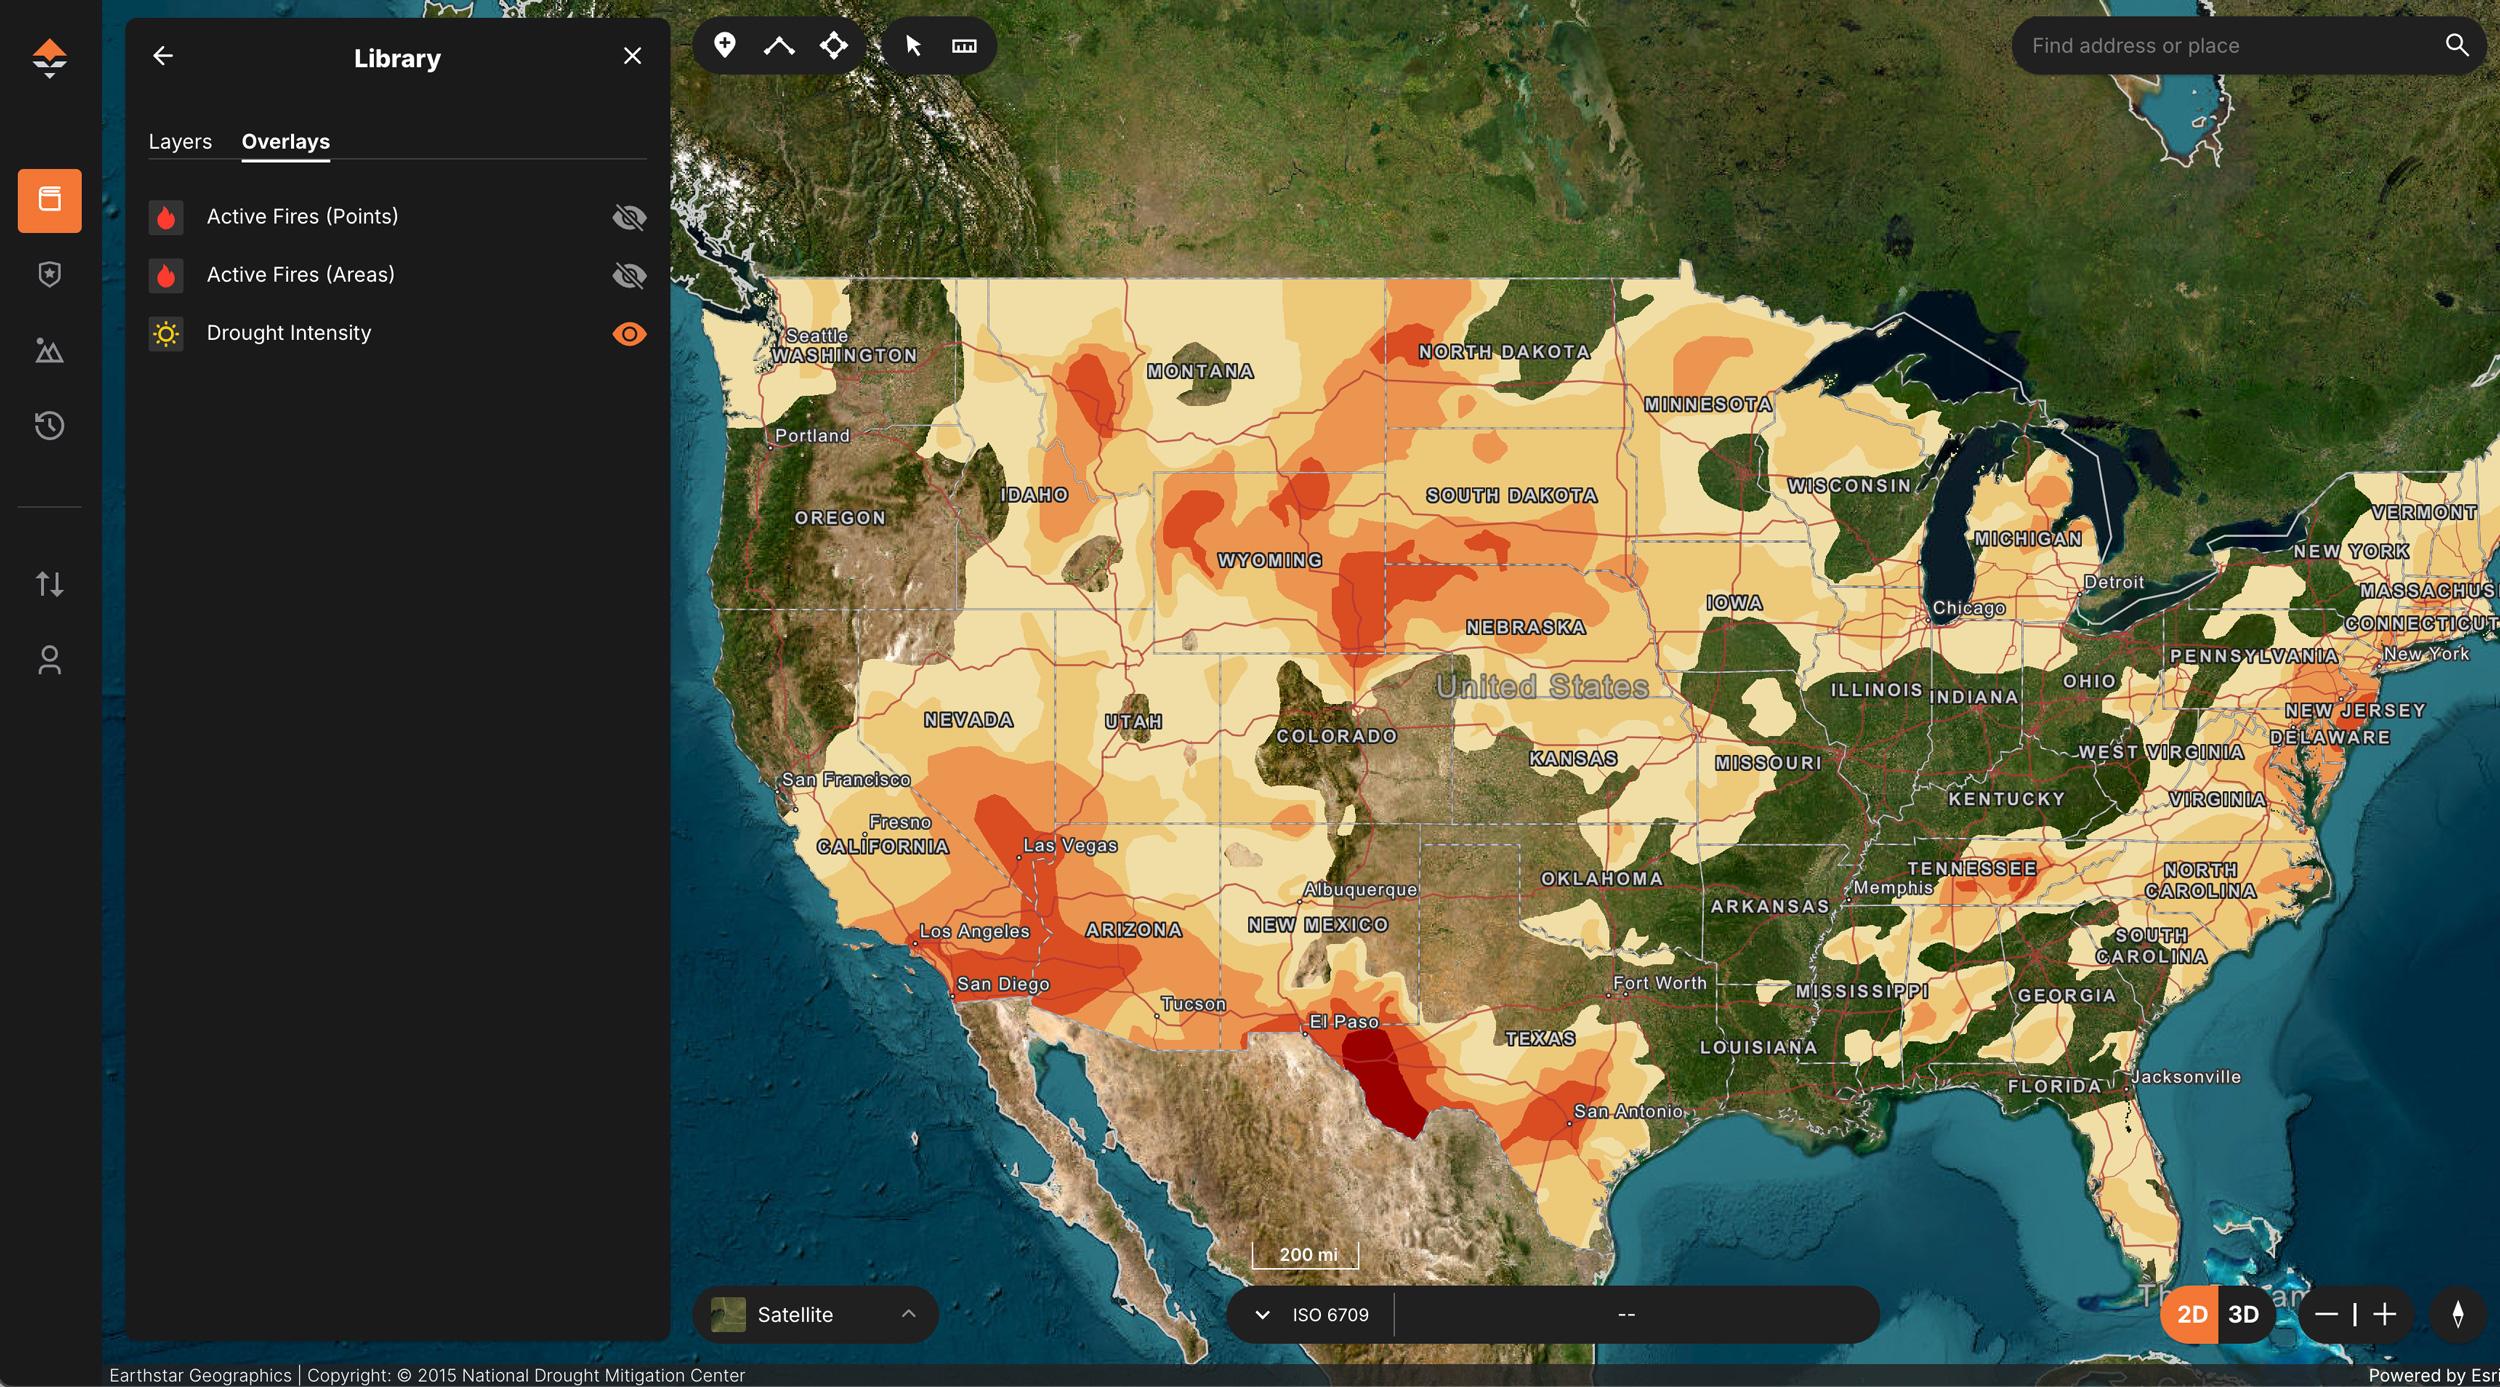
Screenshot showing drought intensity on GOHUNT Maps from early February 2025.
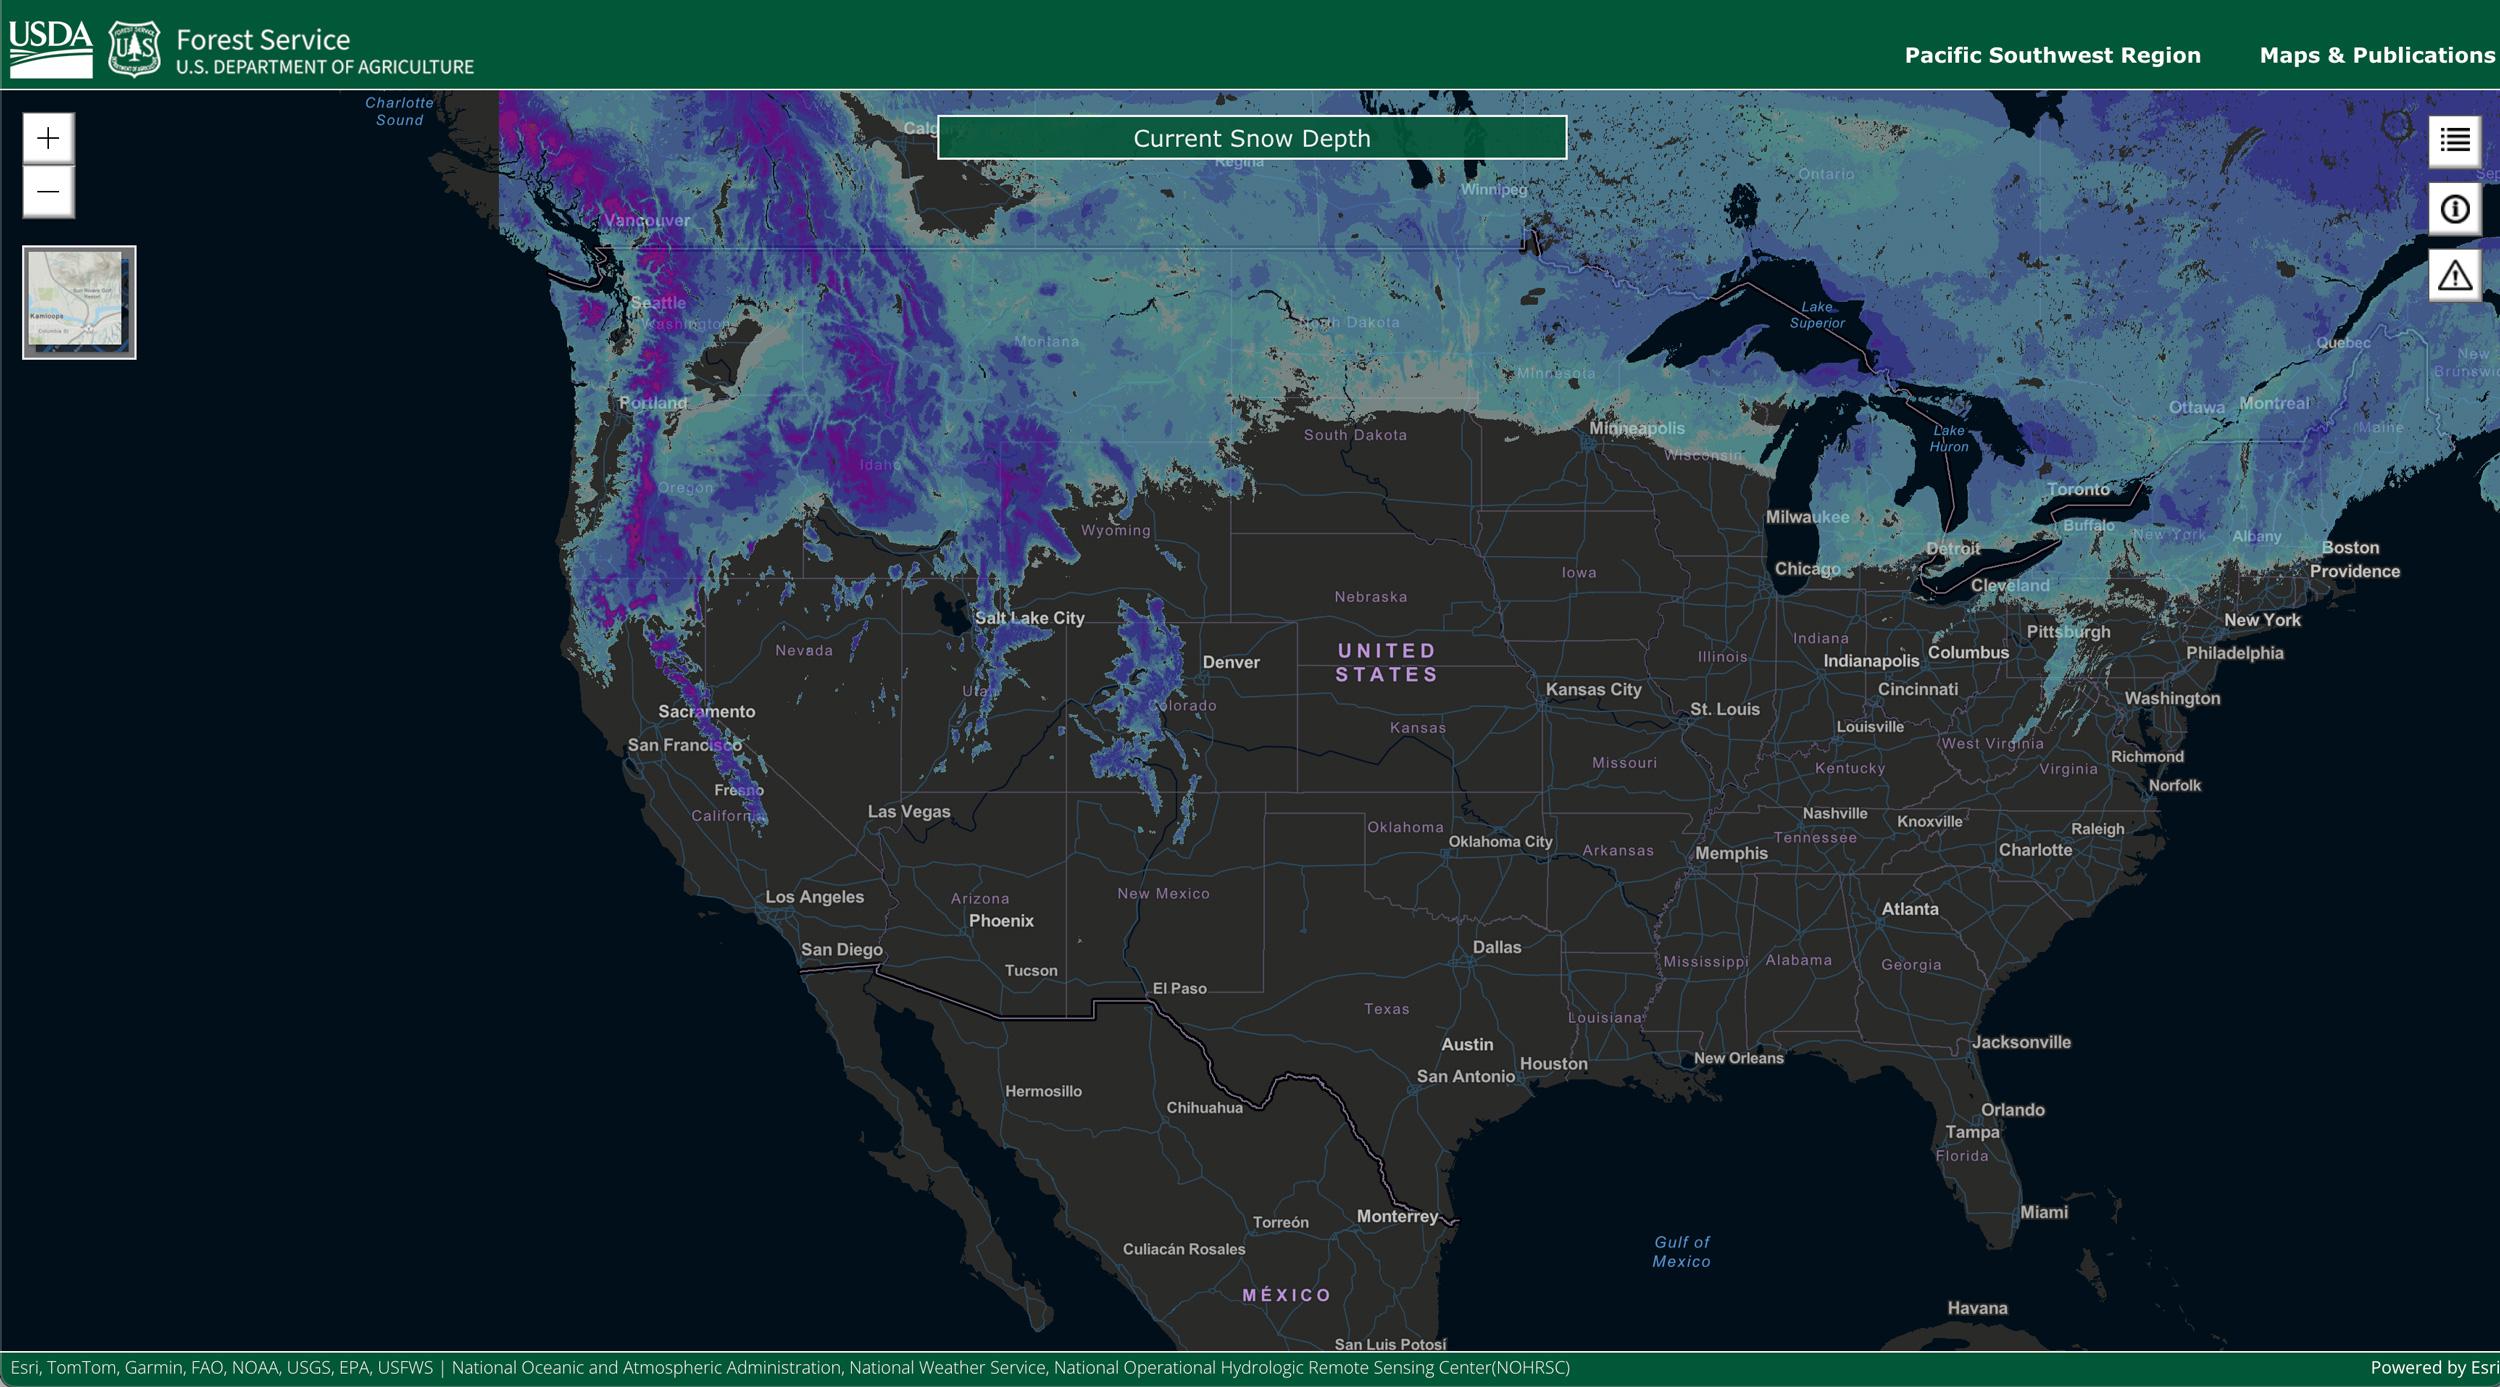
USDA's current snow depth map of the United States as of February 2, 2025.
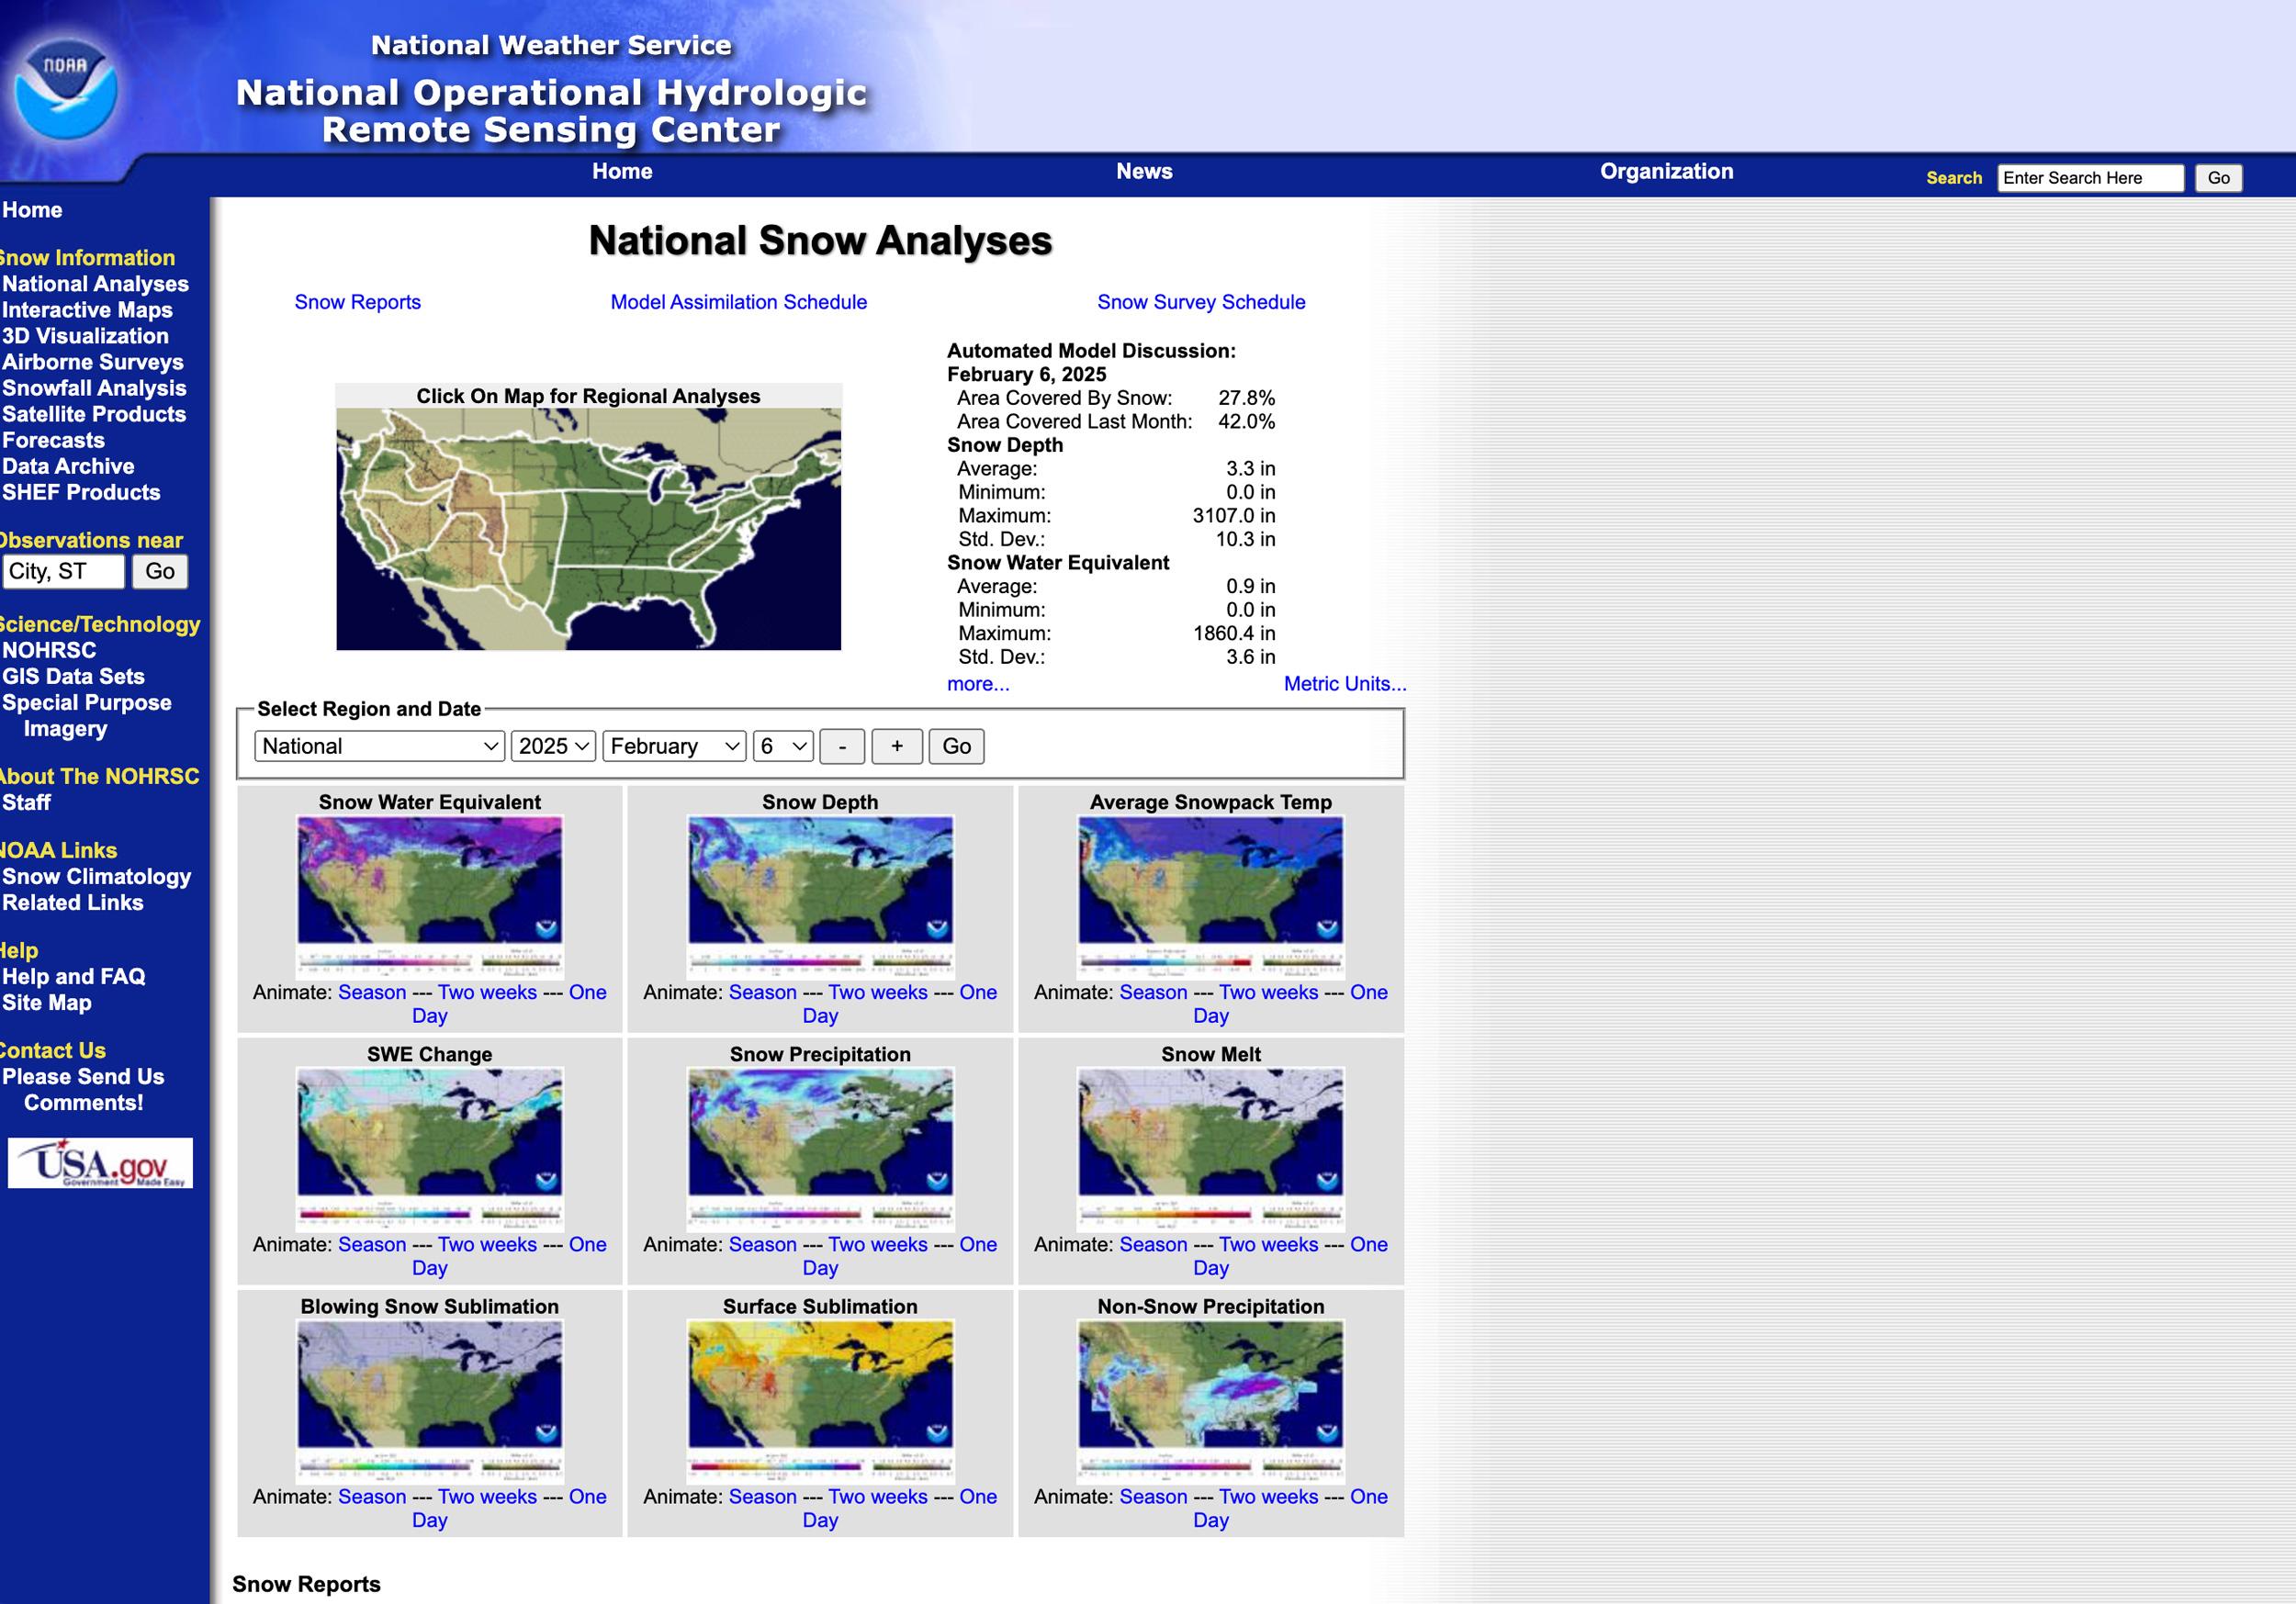
Example of several different maps available from the National Snow Analyses data set.

February 2, 2025, Western United States snow water equivalent percent map.
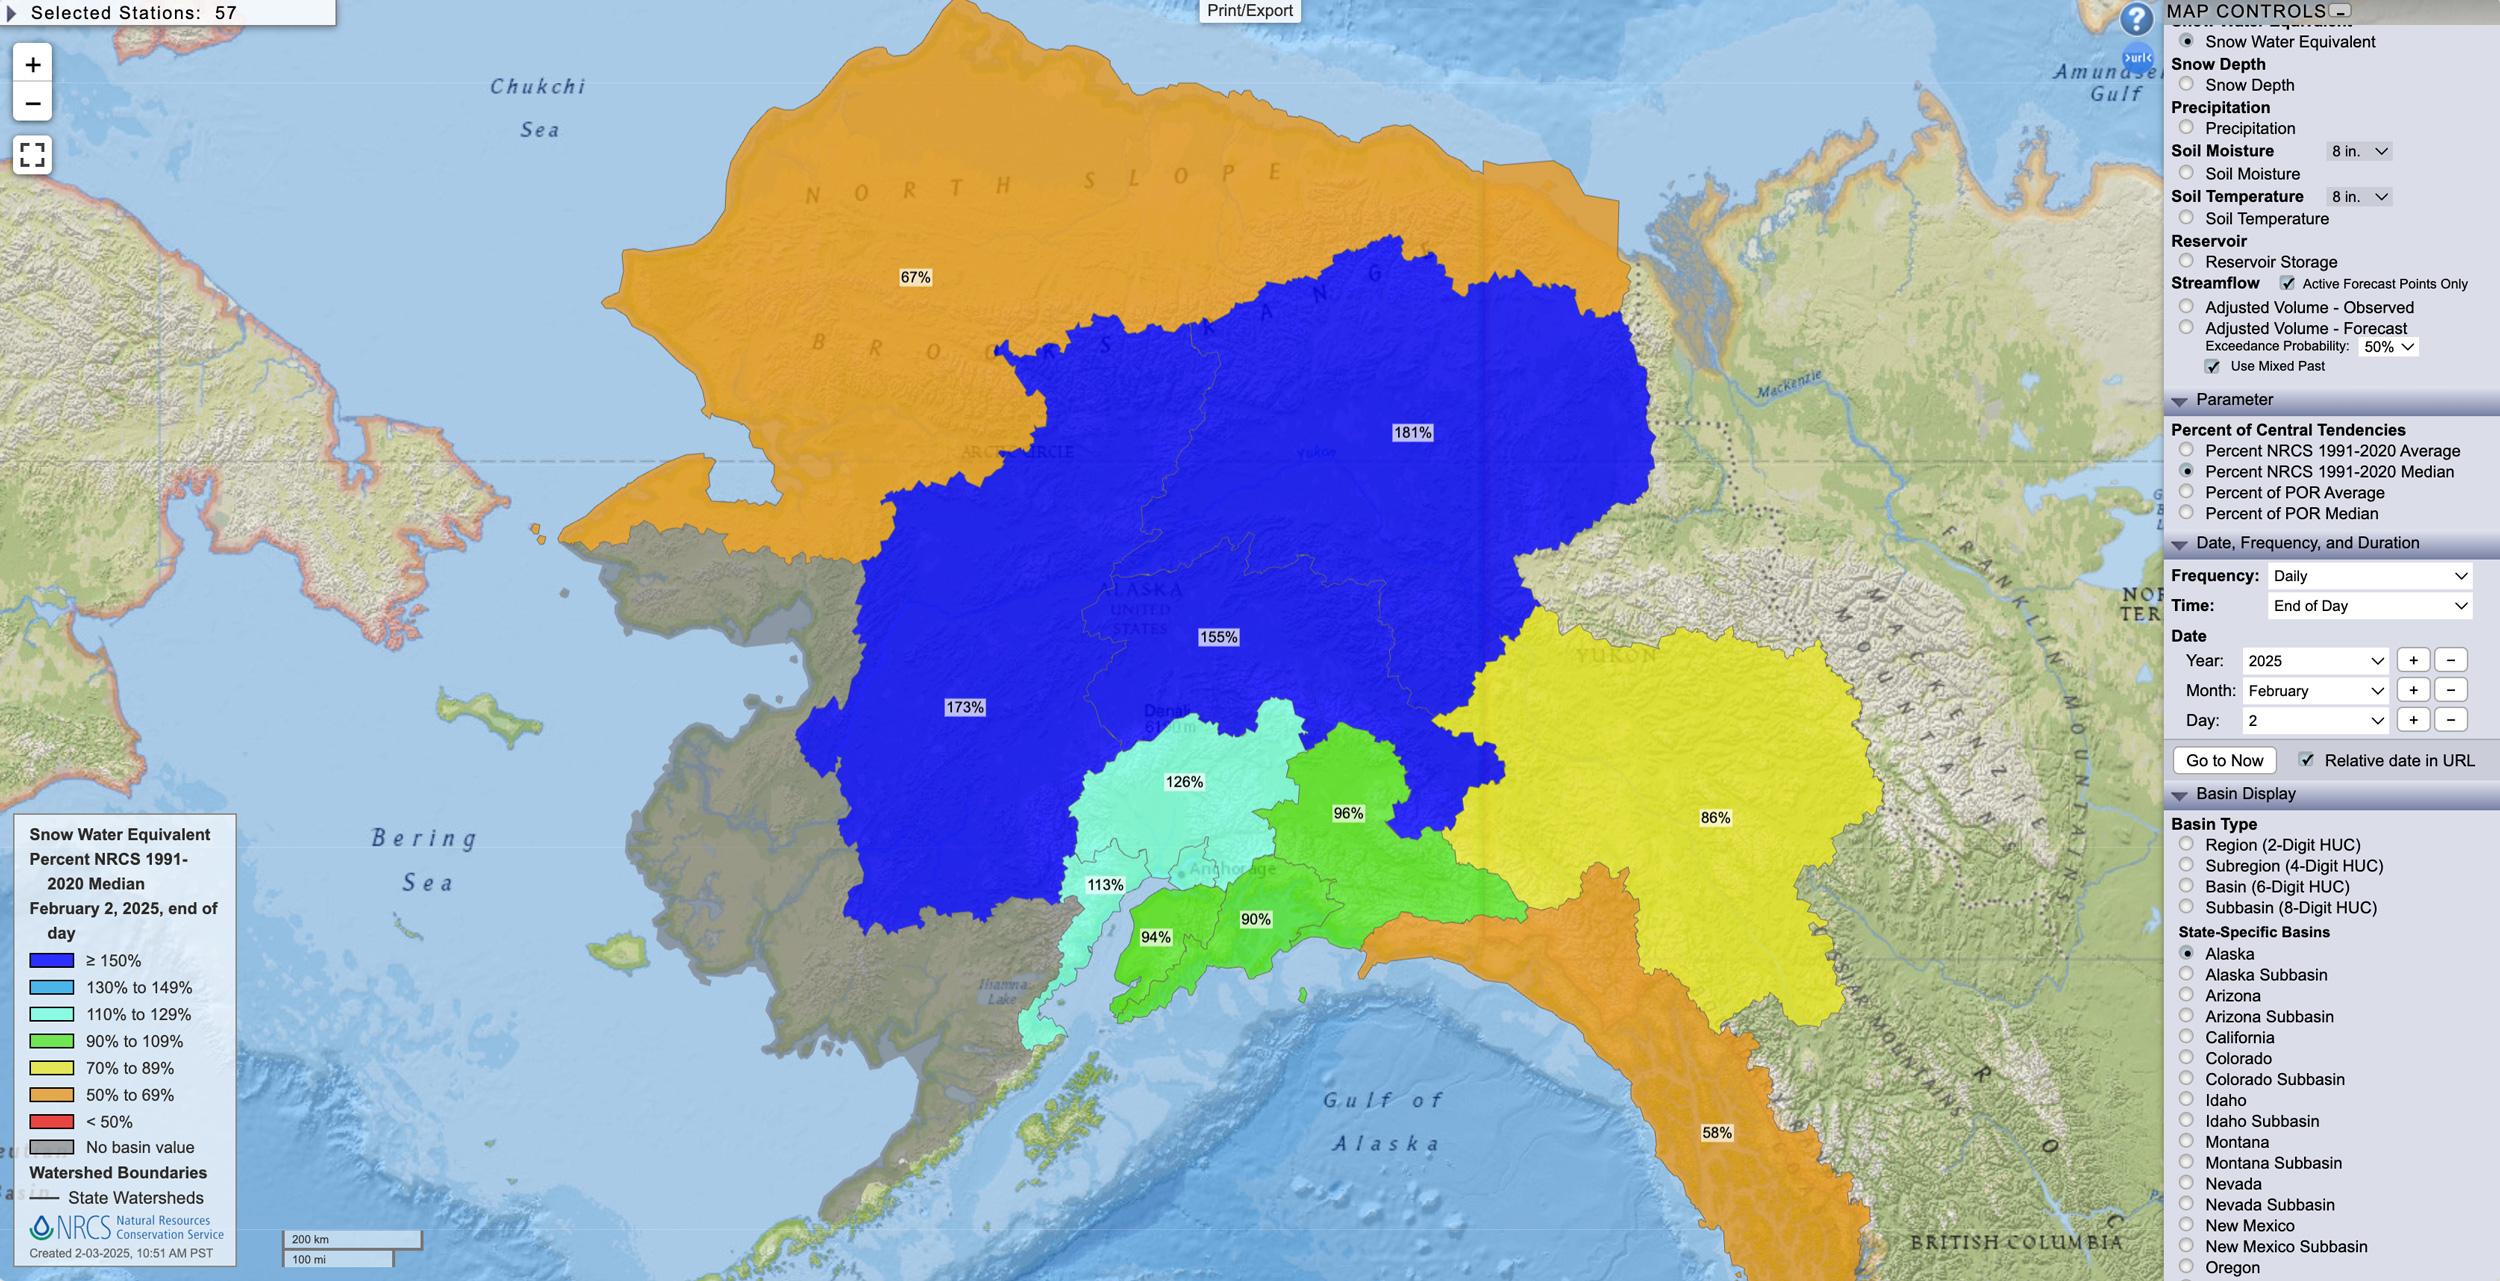
Alaska February 2, 2025 snow water equivalent percent map.
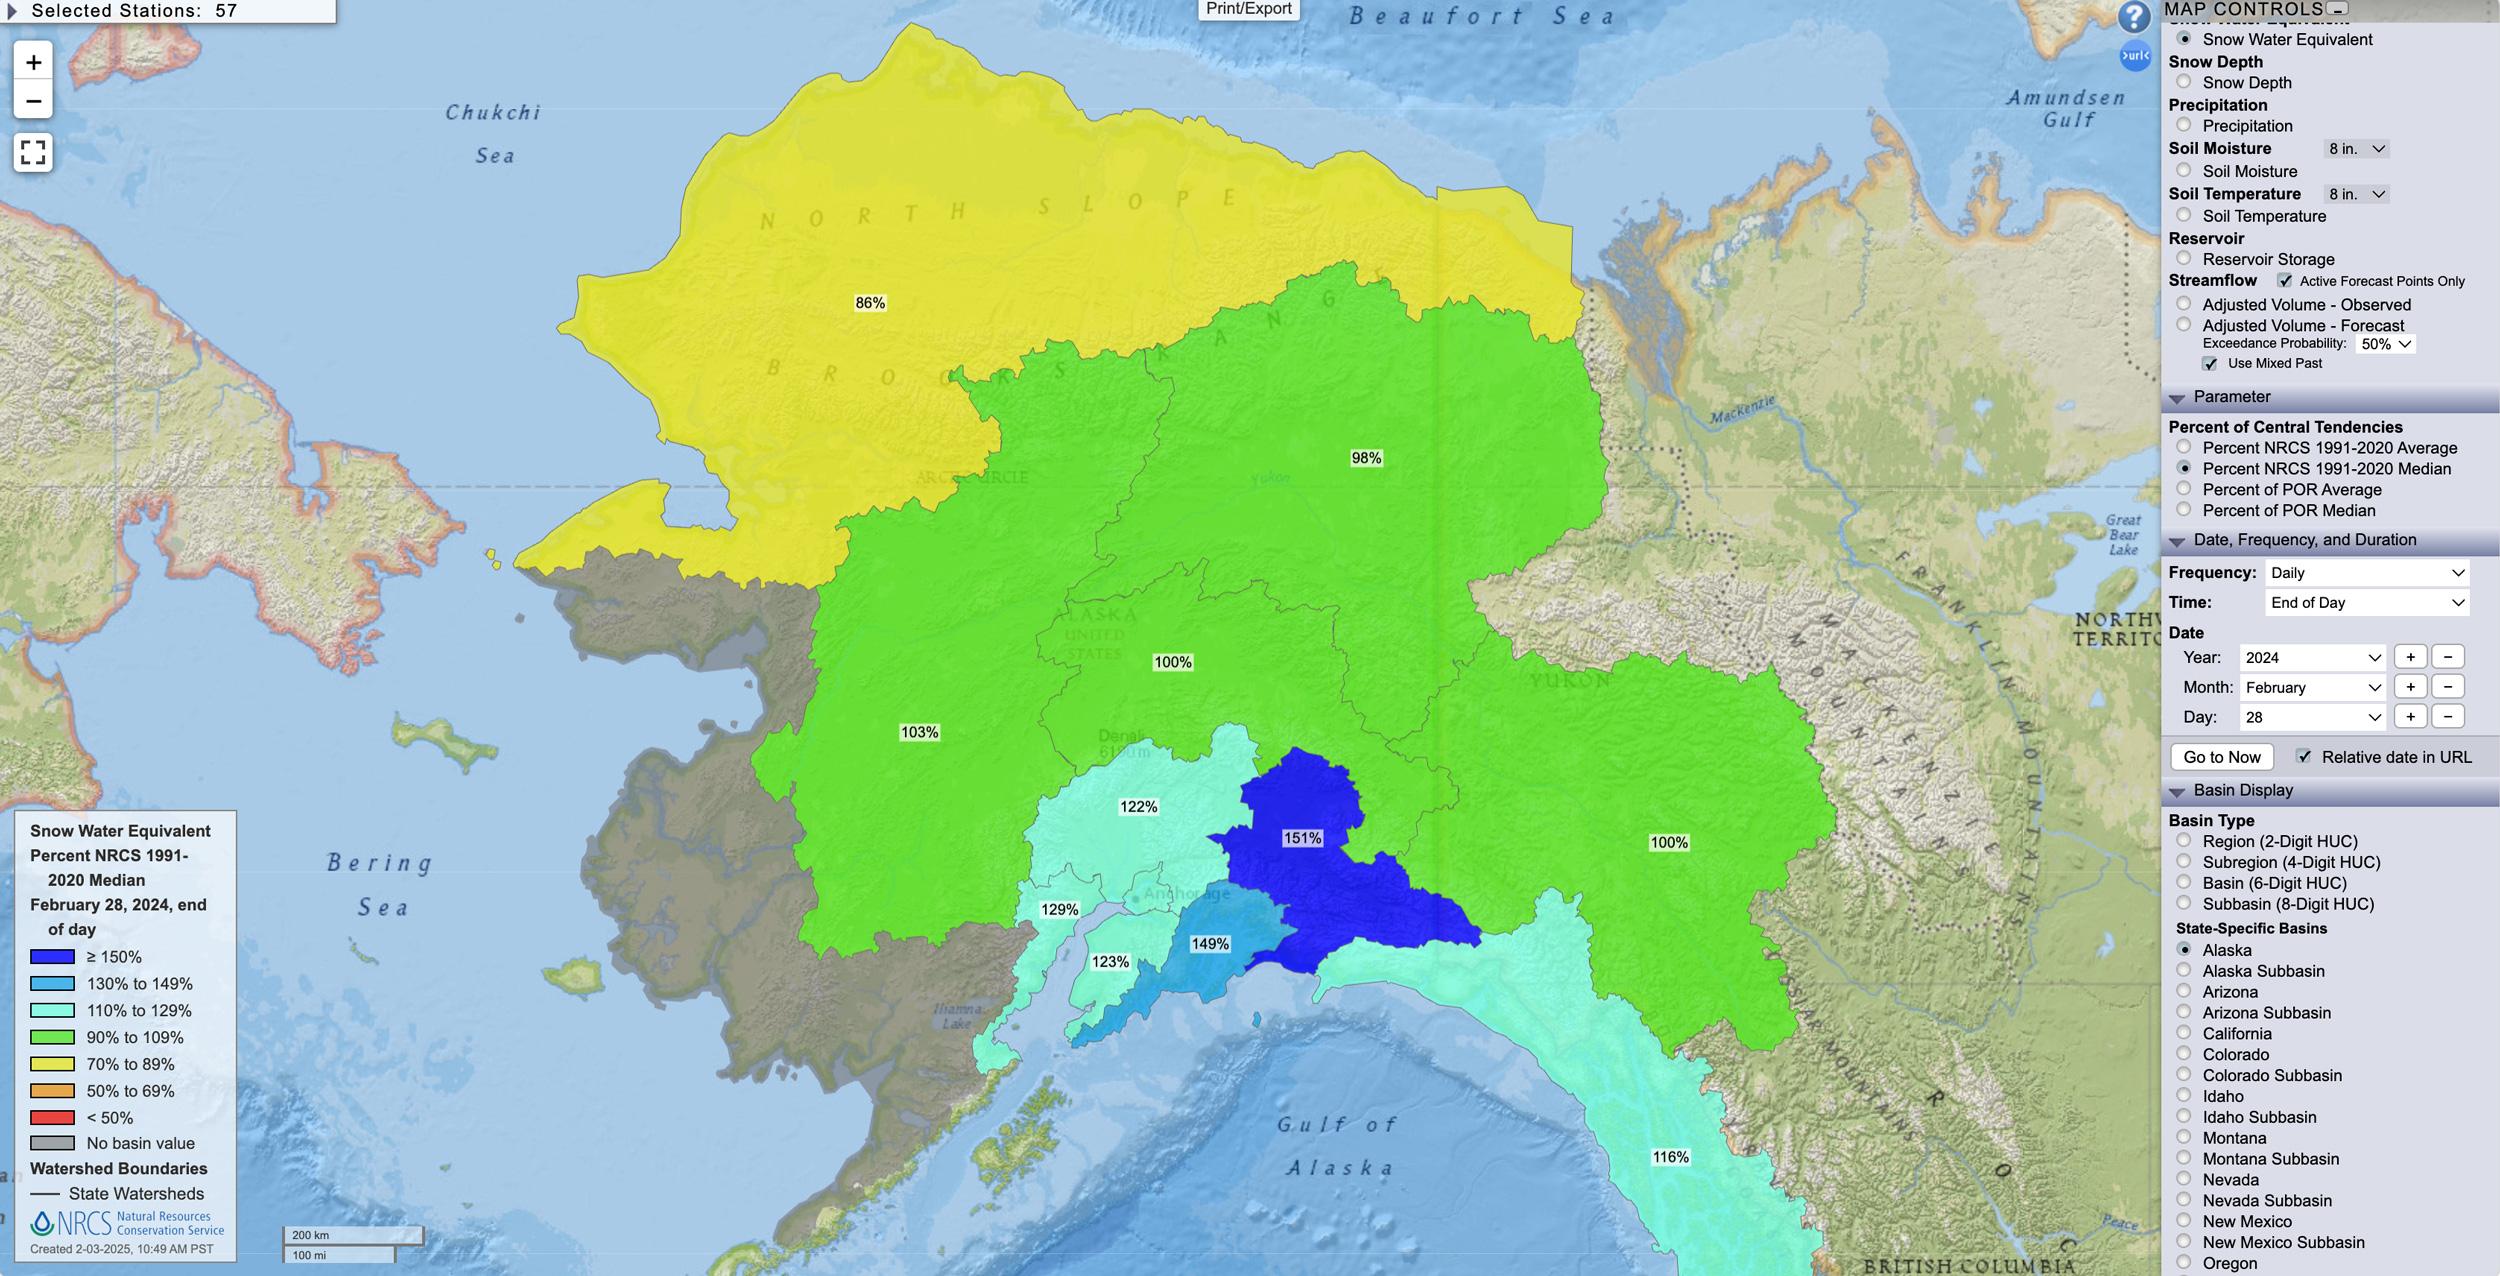
Alaska February 28, 2024 snow water equivalent percent map.
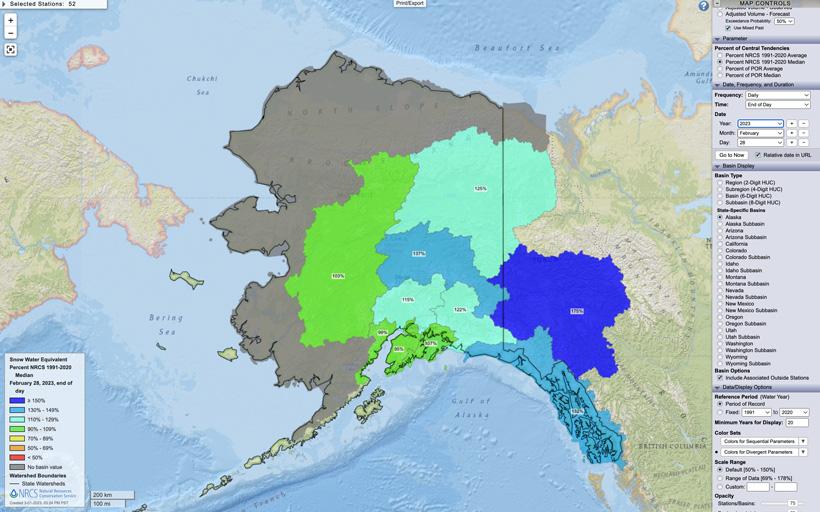
Alaska February 28, 2023 snow water equivalent percent map.
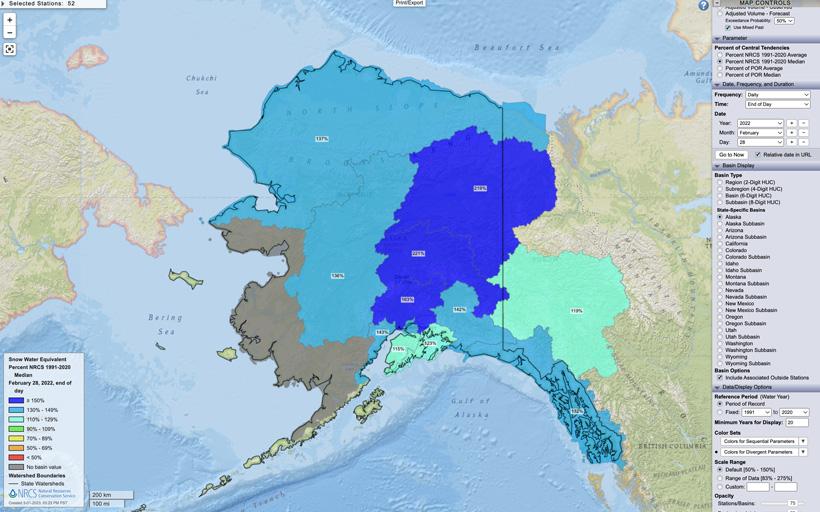
Alaska February 28, 2022 snow water equivalent percent map.
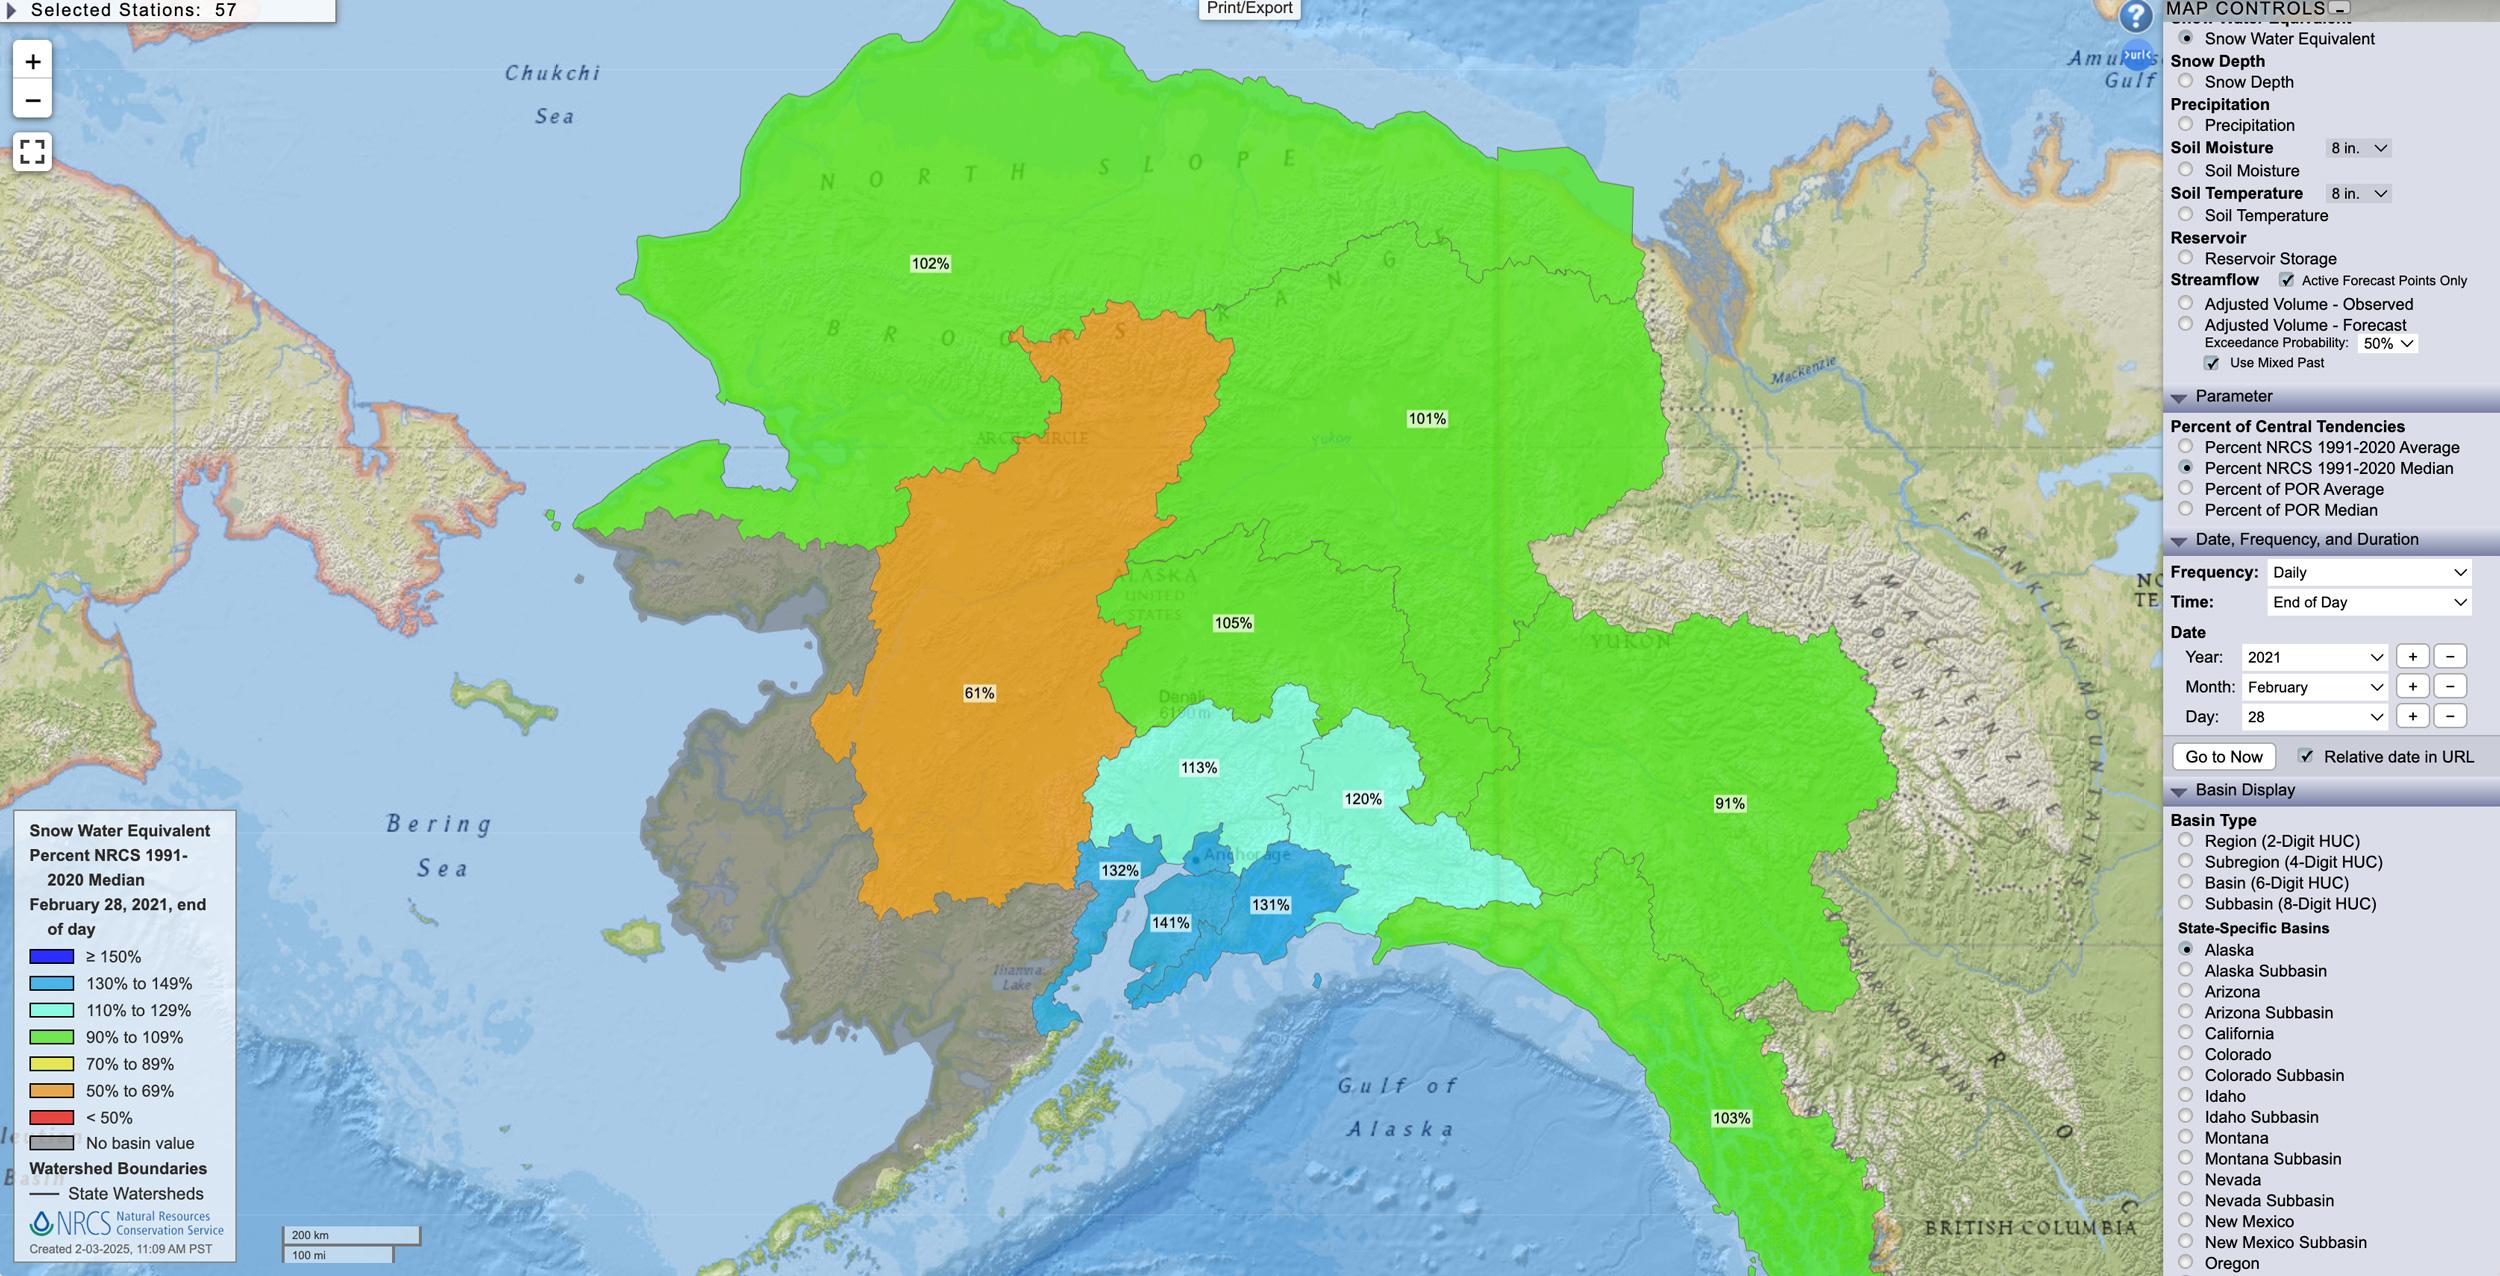
Alaska February 28, 2021 snow water equivalent percent map.
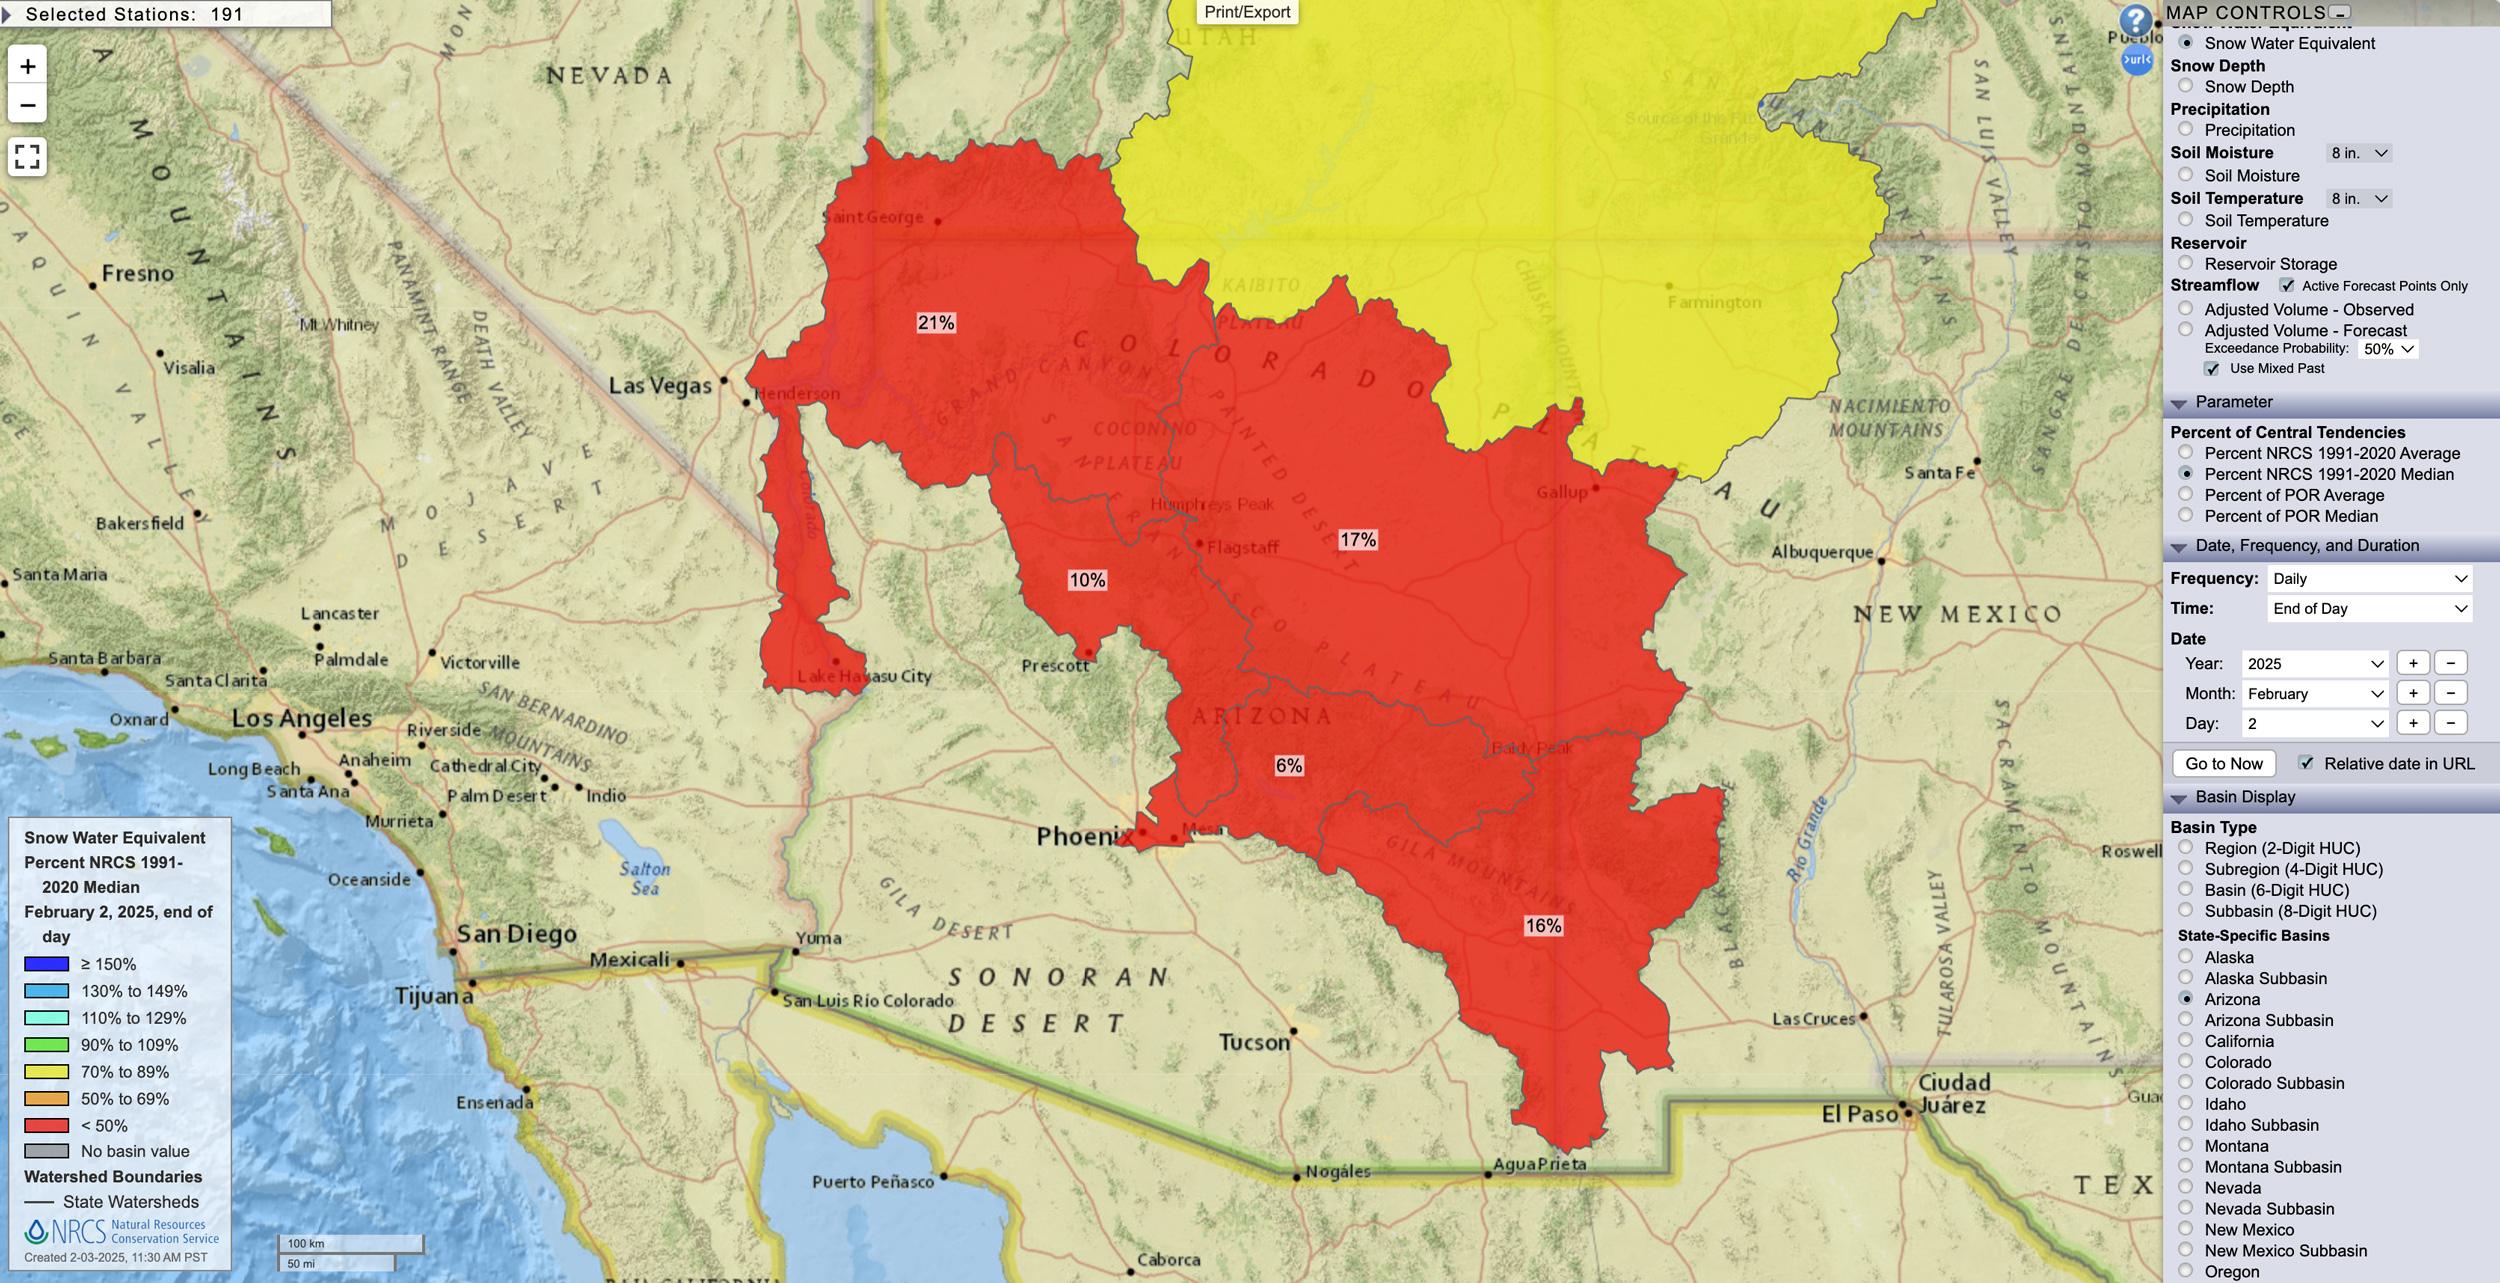
Arizona February 2, 2025 snow water equivalent percent map.
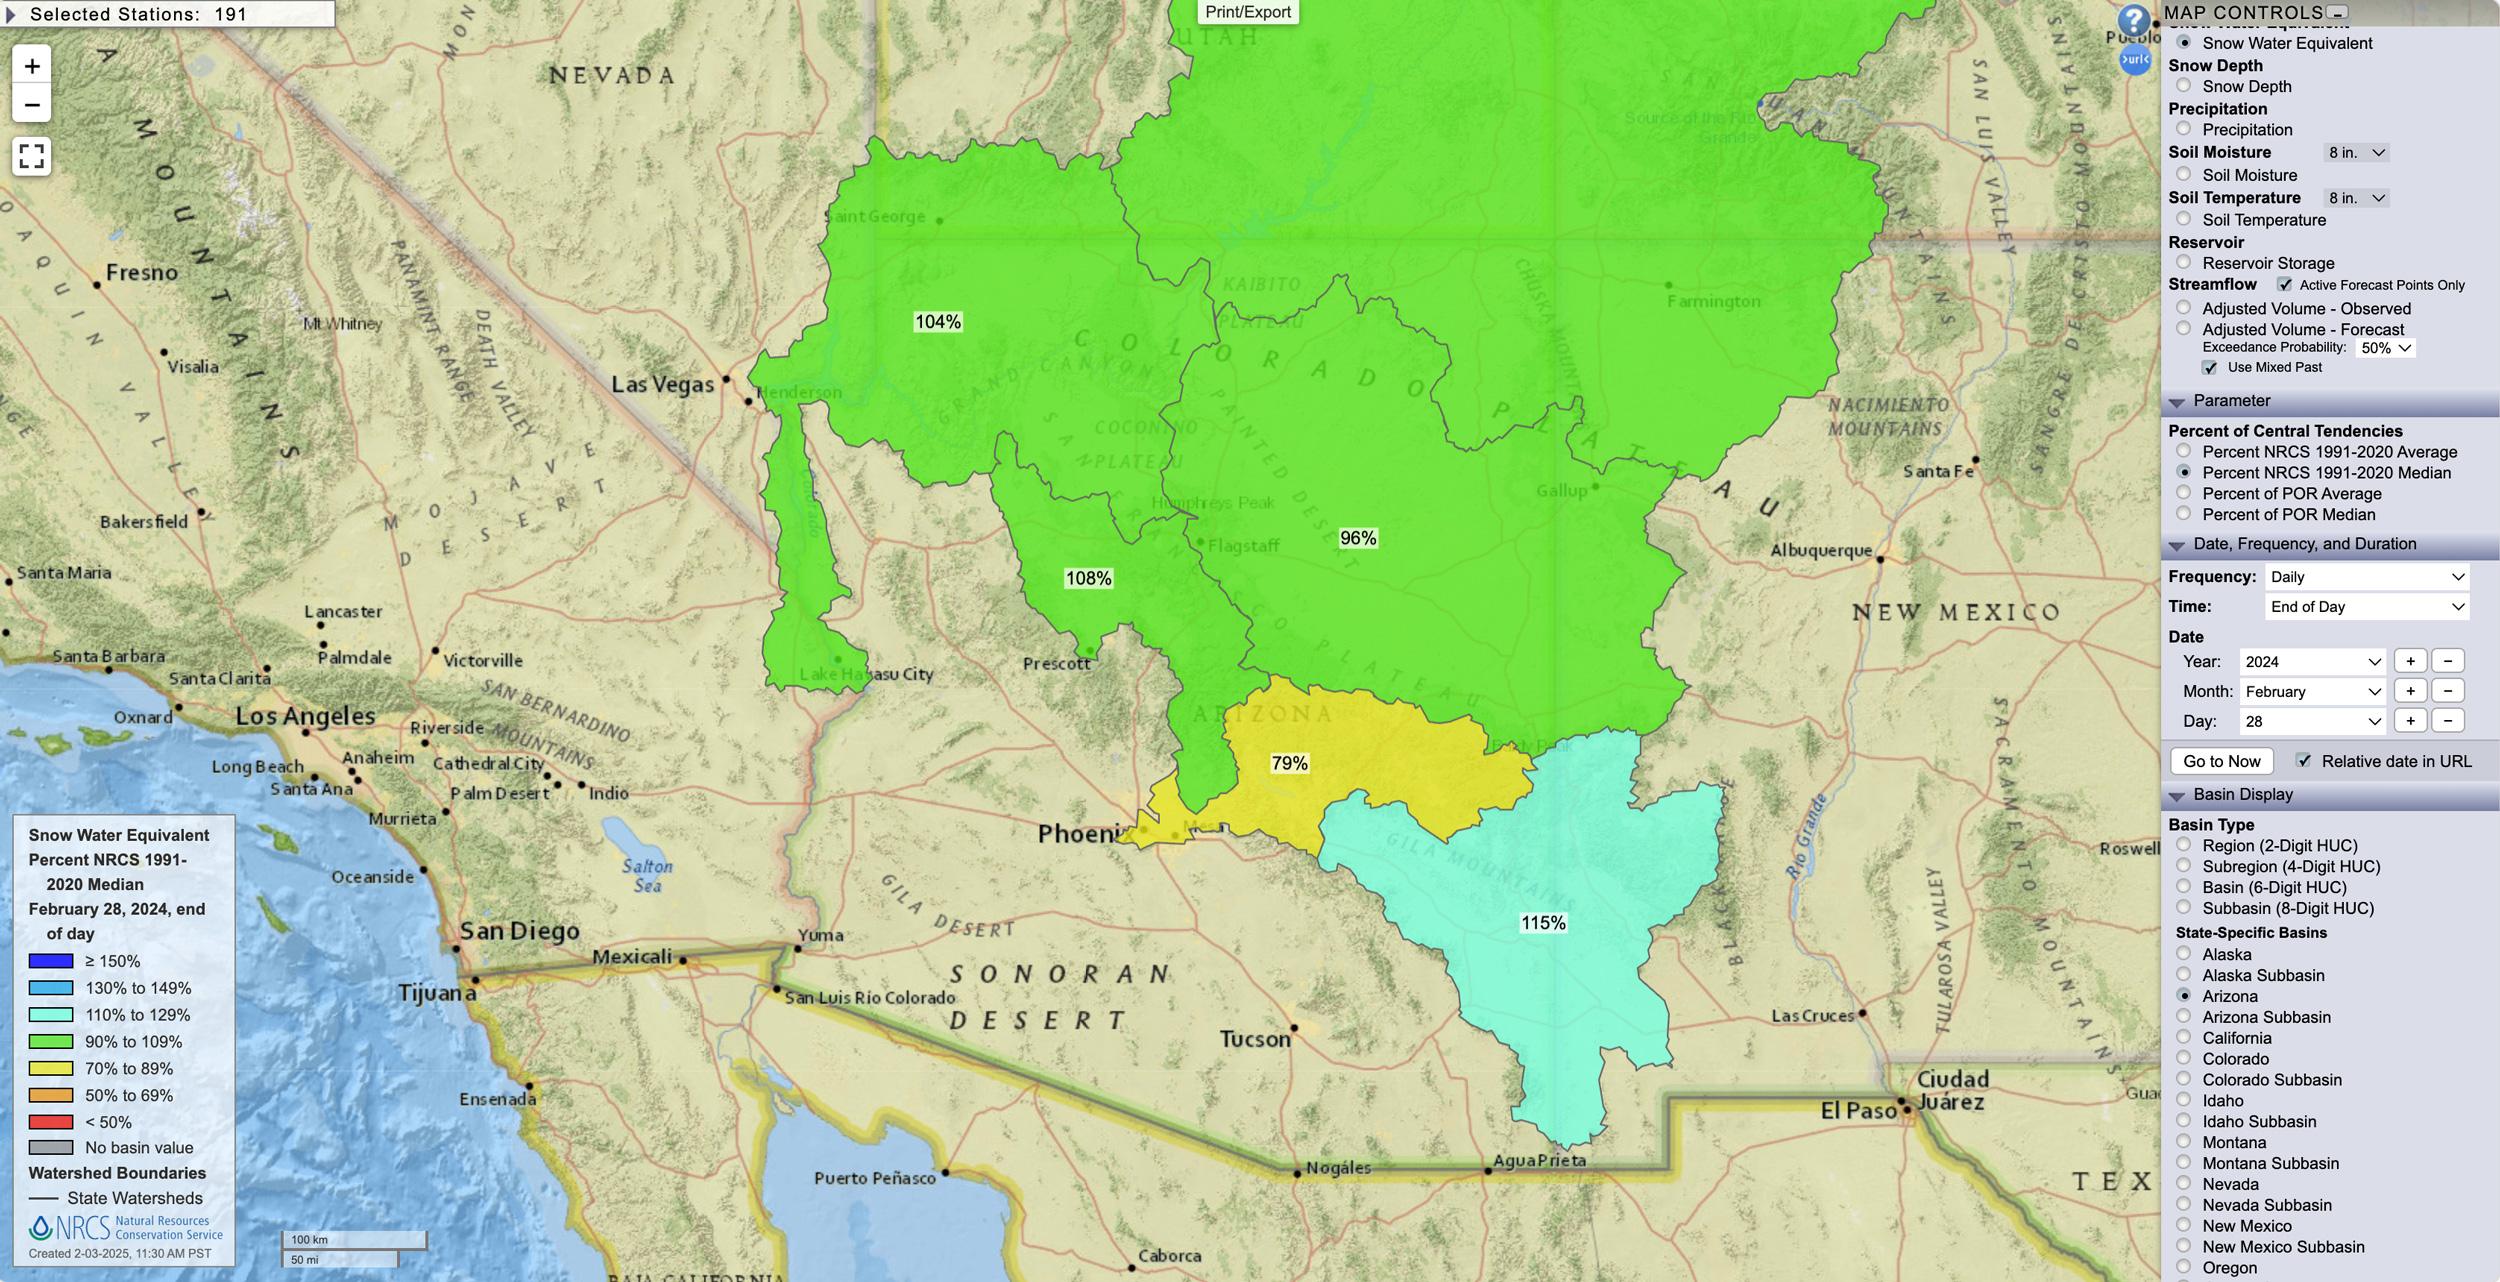
Arizona February 28, 2024 snow water equivalent percent map.
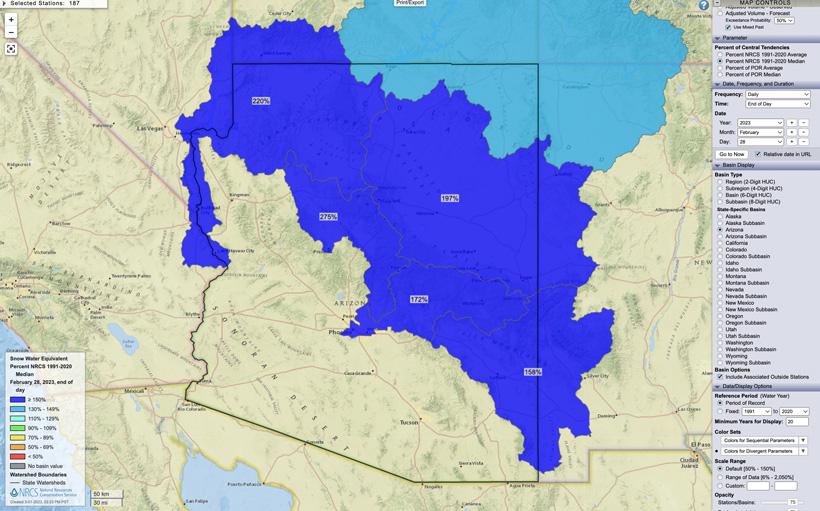
Arizona February 28, 2023 snow water equivalent percent map.
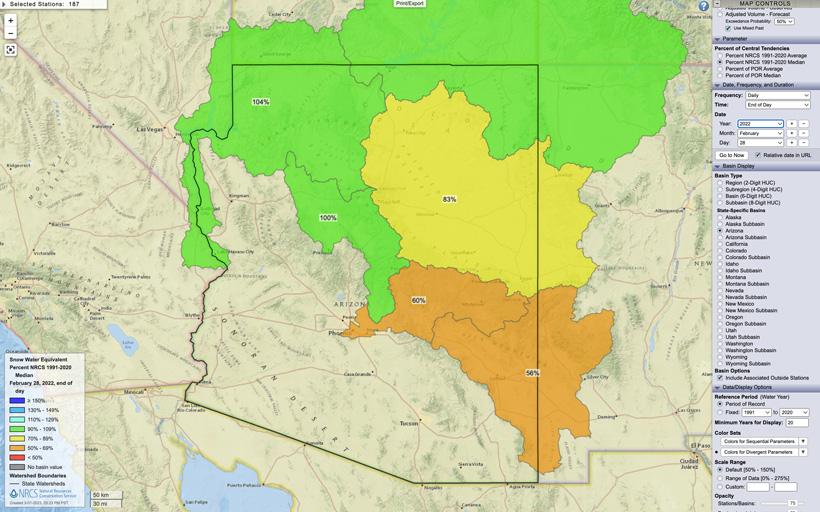
Arizona February 28, 2022 snow water equivalent percent map.
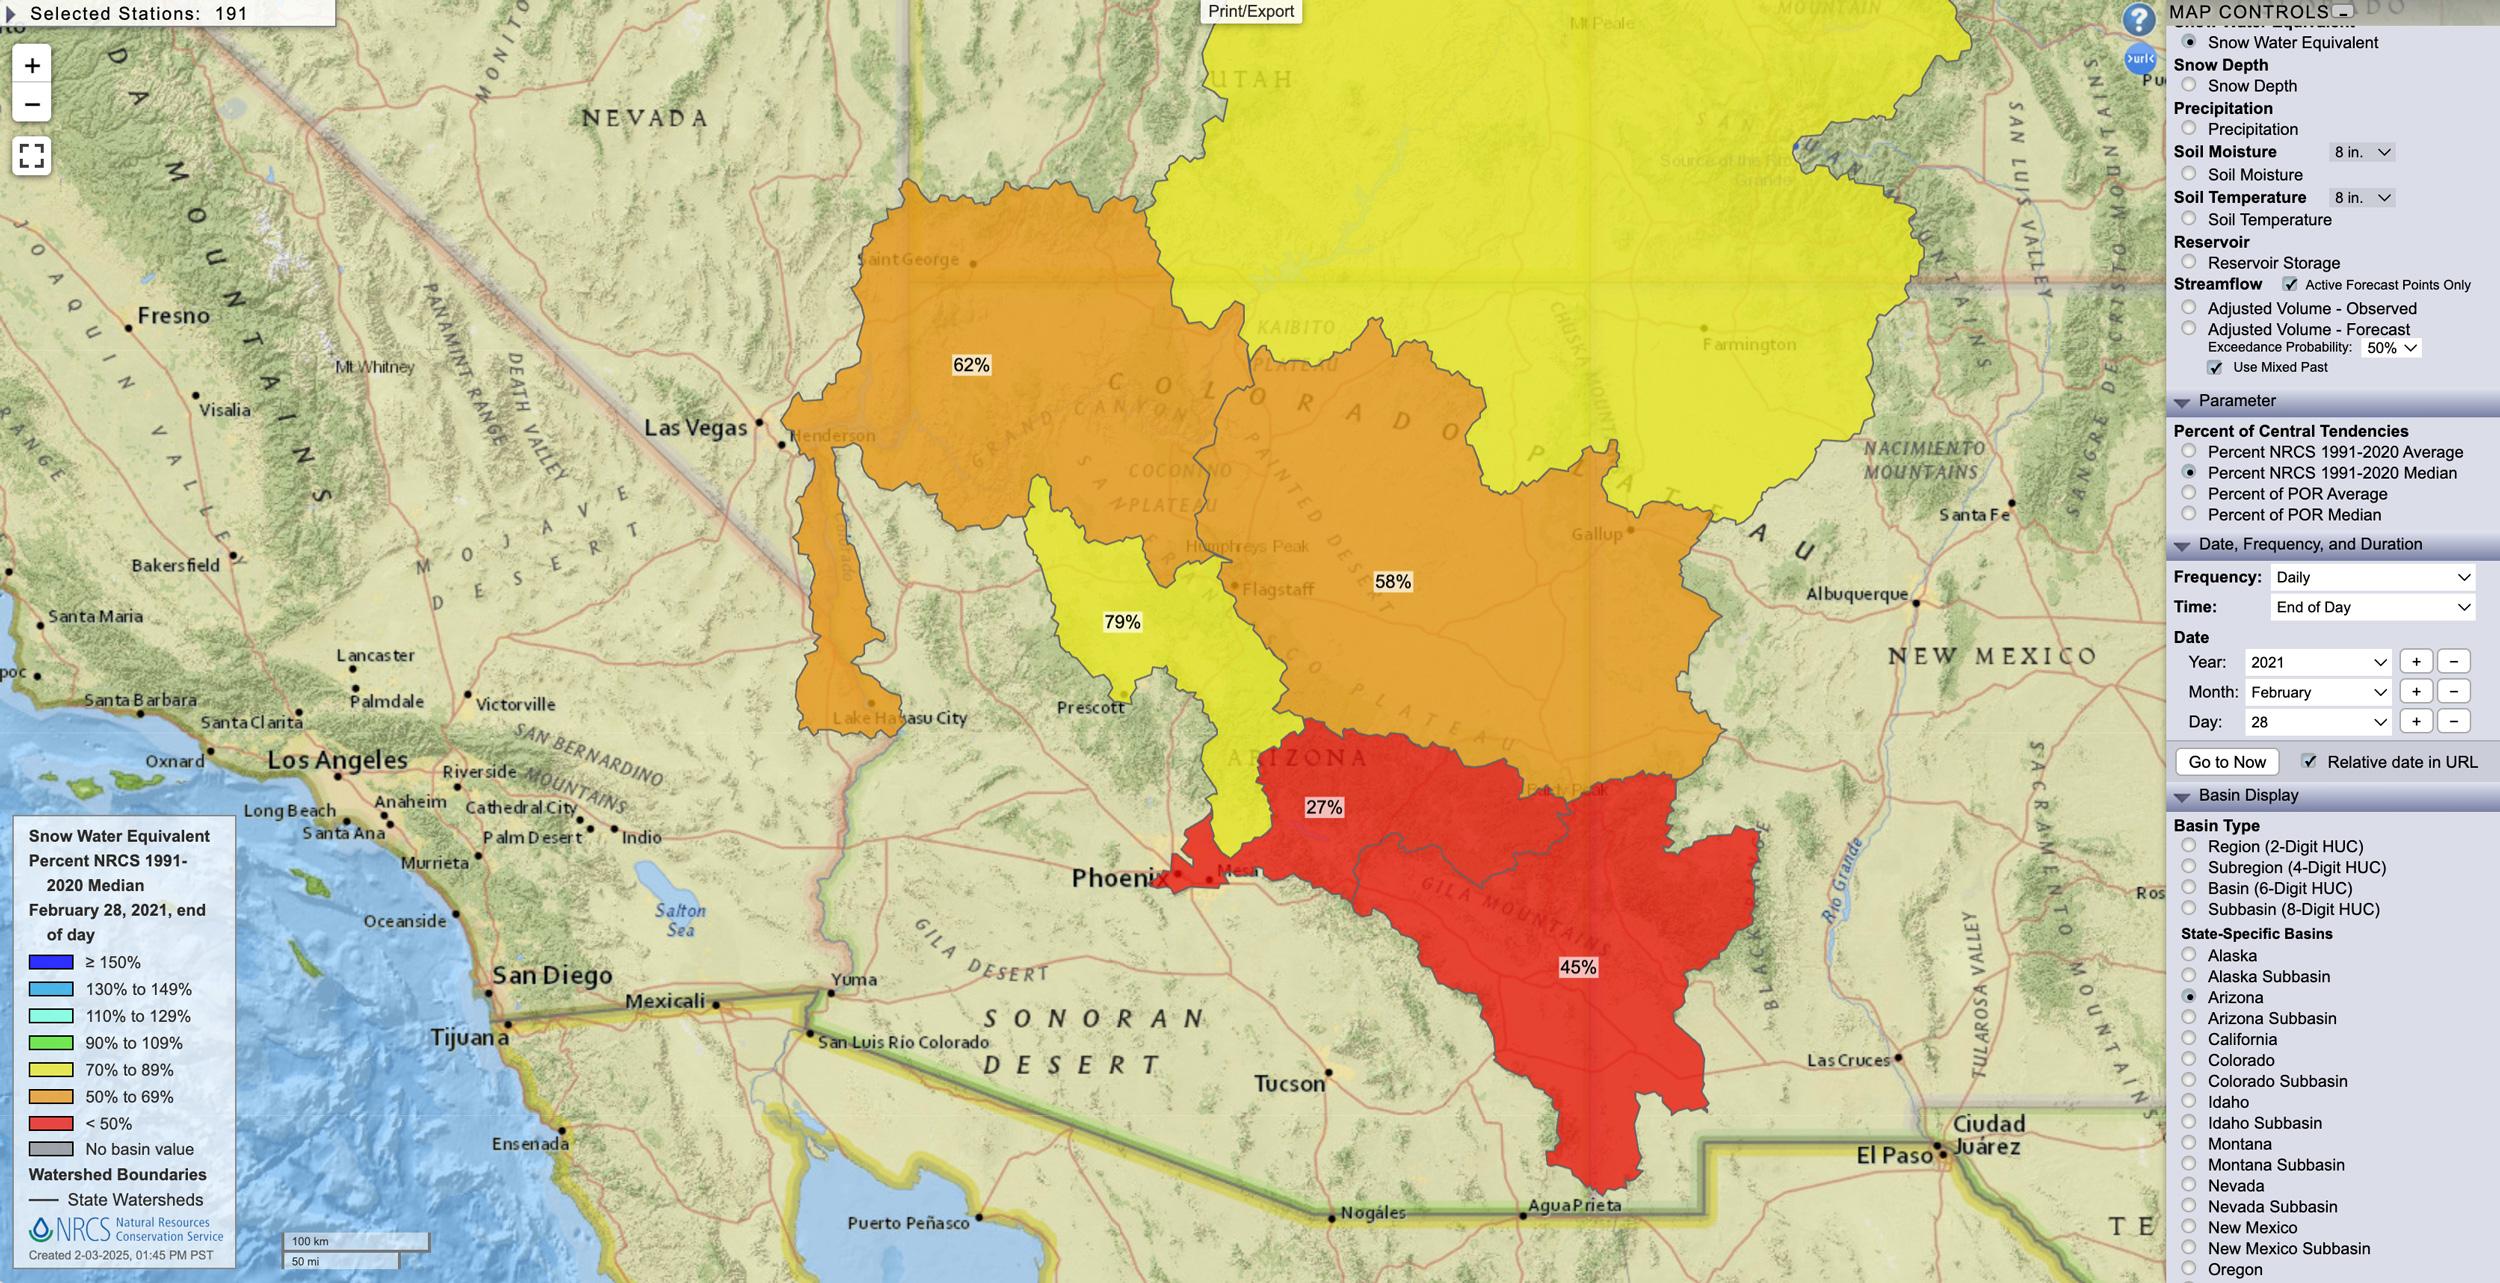
Arizona February 28, 2021 snow water equivalent percent map.
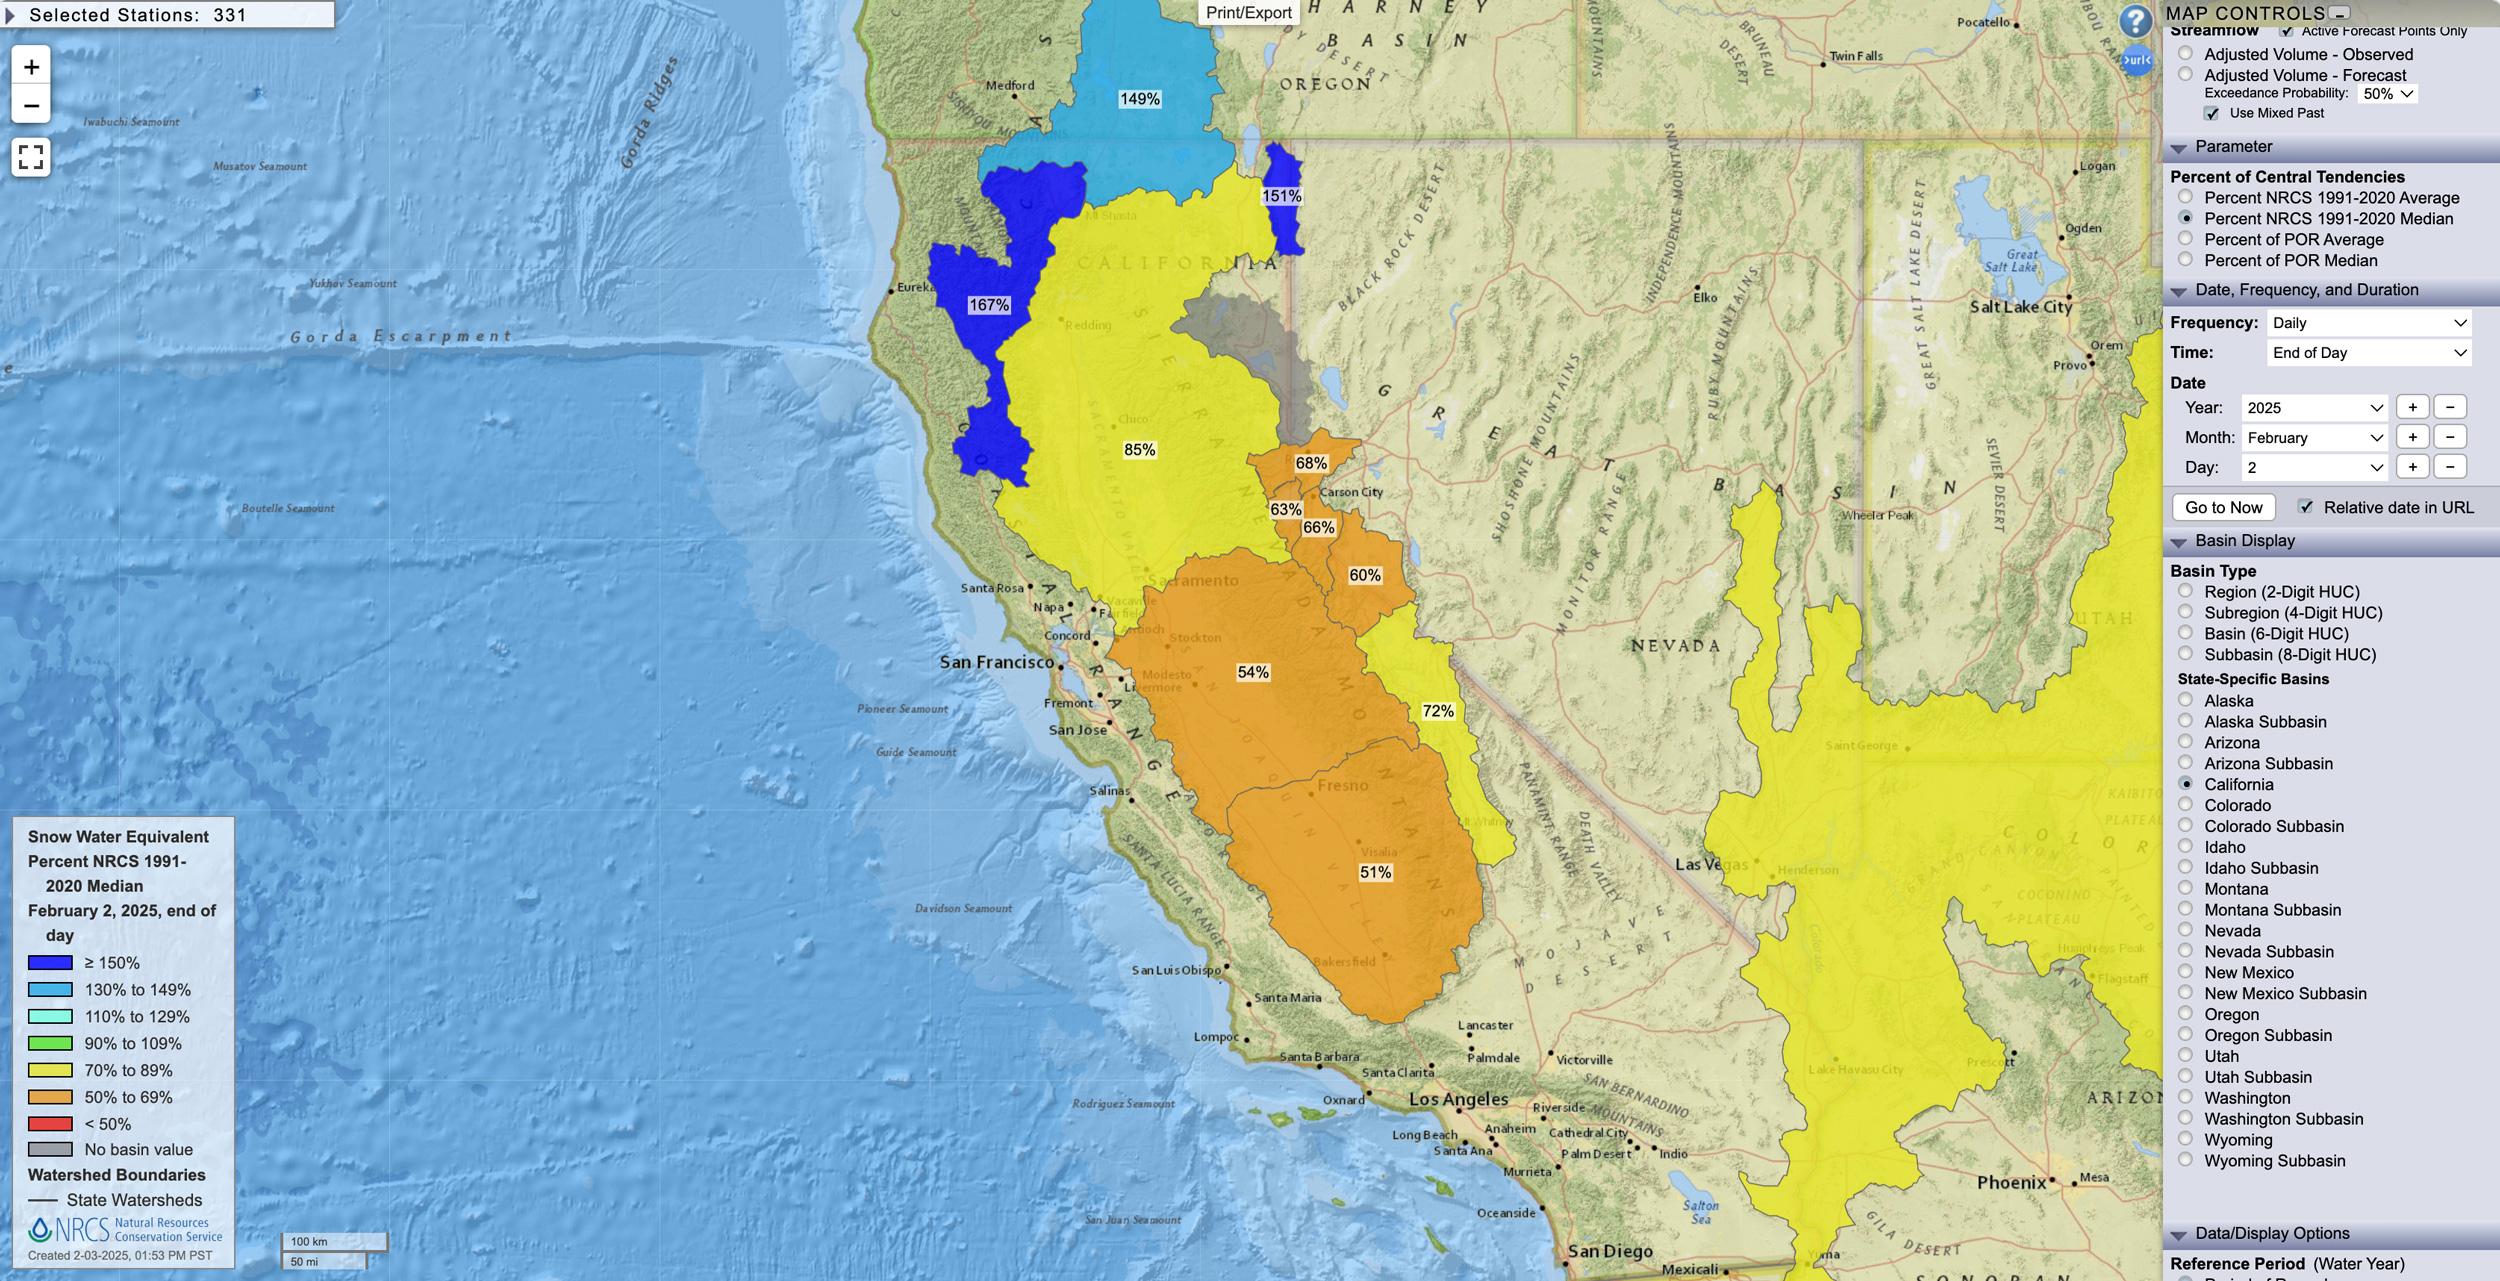
California February 2, 2025 snow water equivalent percent map.
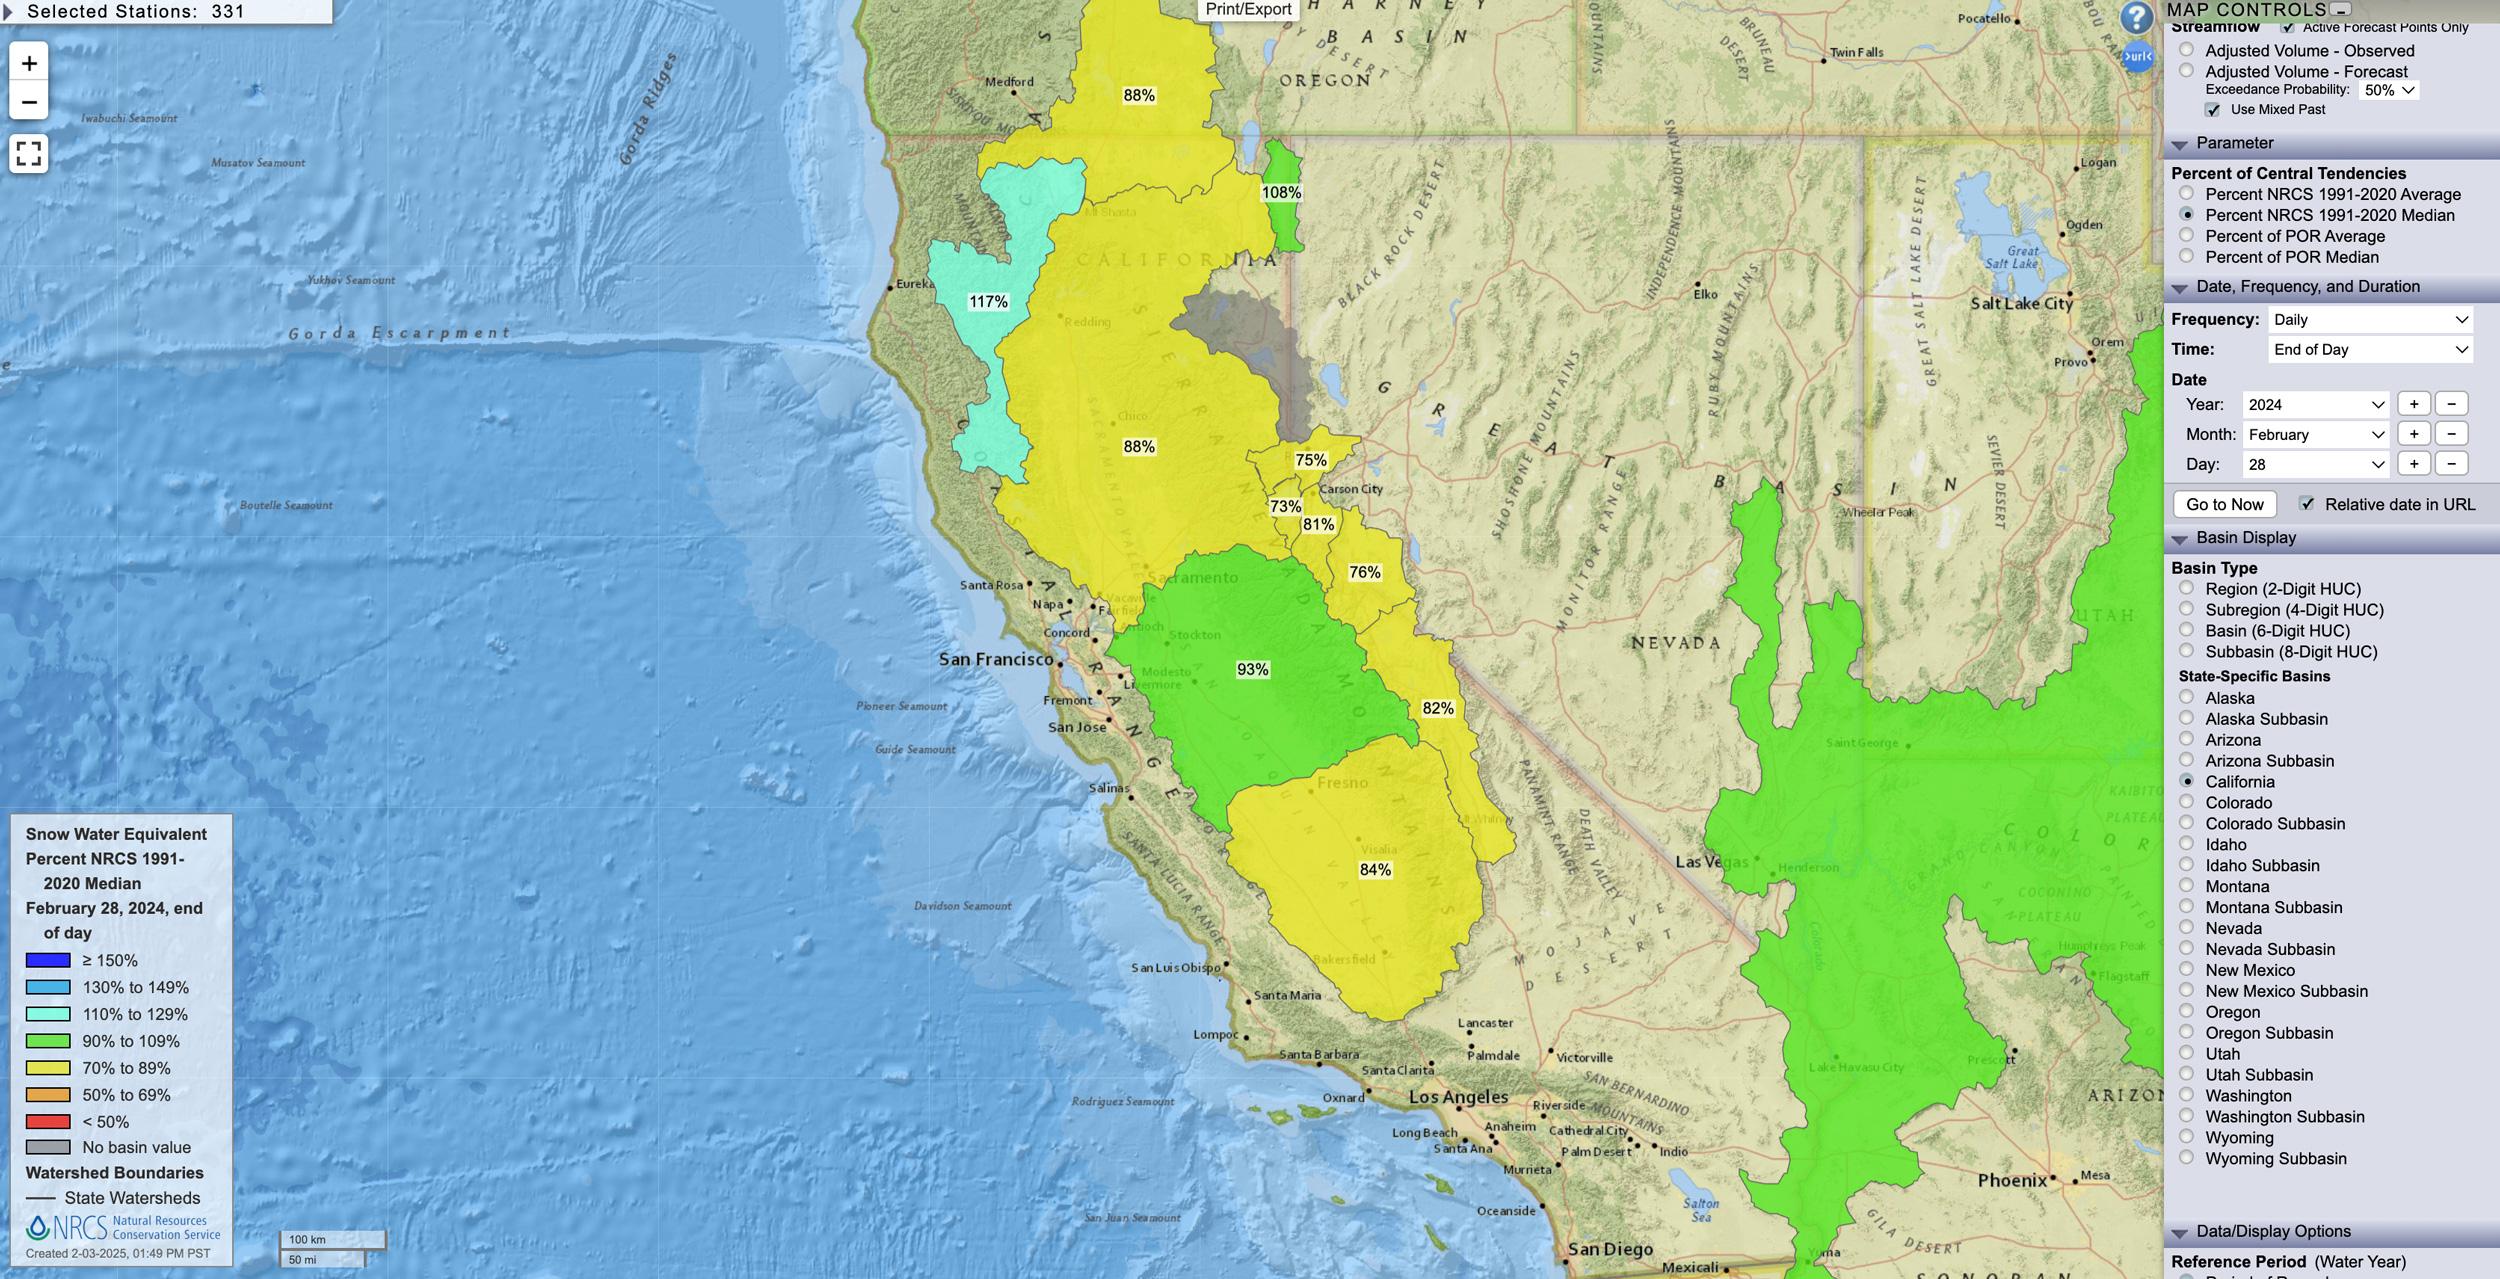
California February 28, 2024 snow water equivalent percent map.
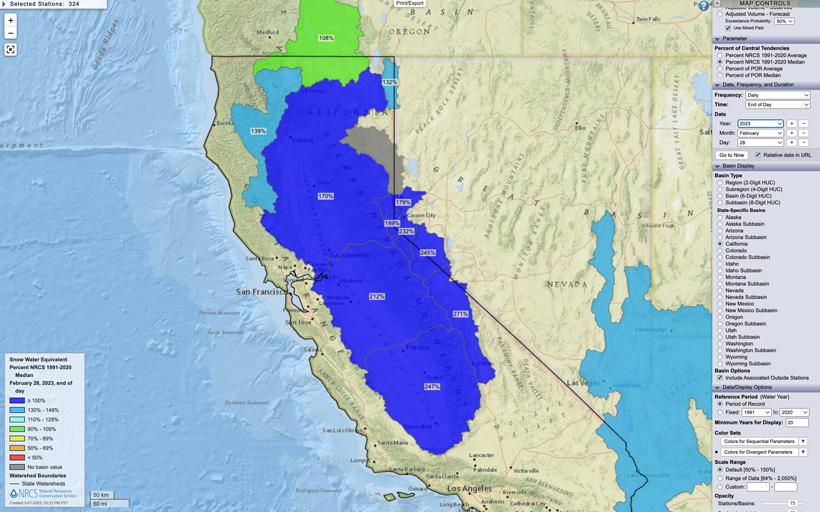
California February 28, 2023 snow water equivalent percent map.
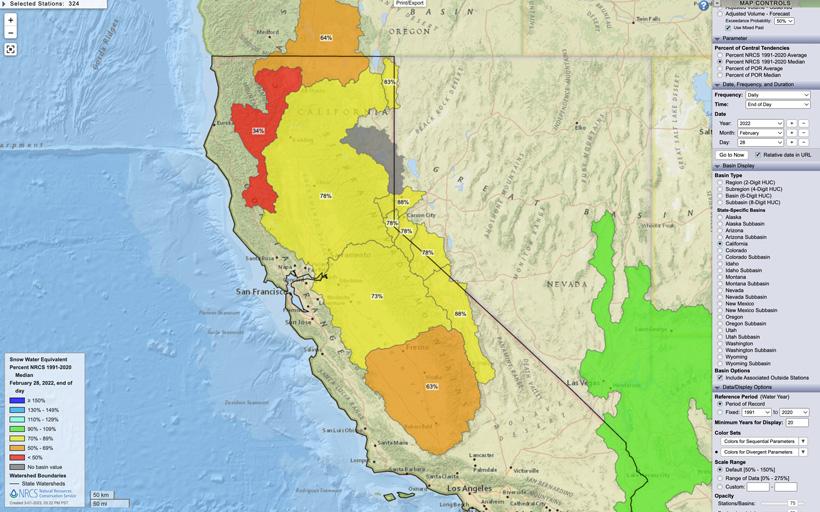
California February 28, 2022 snow water equivalent percent map.
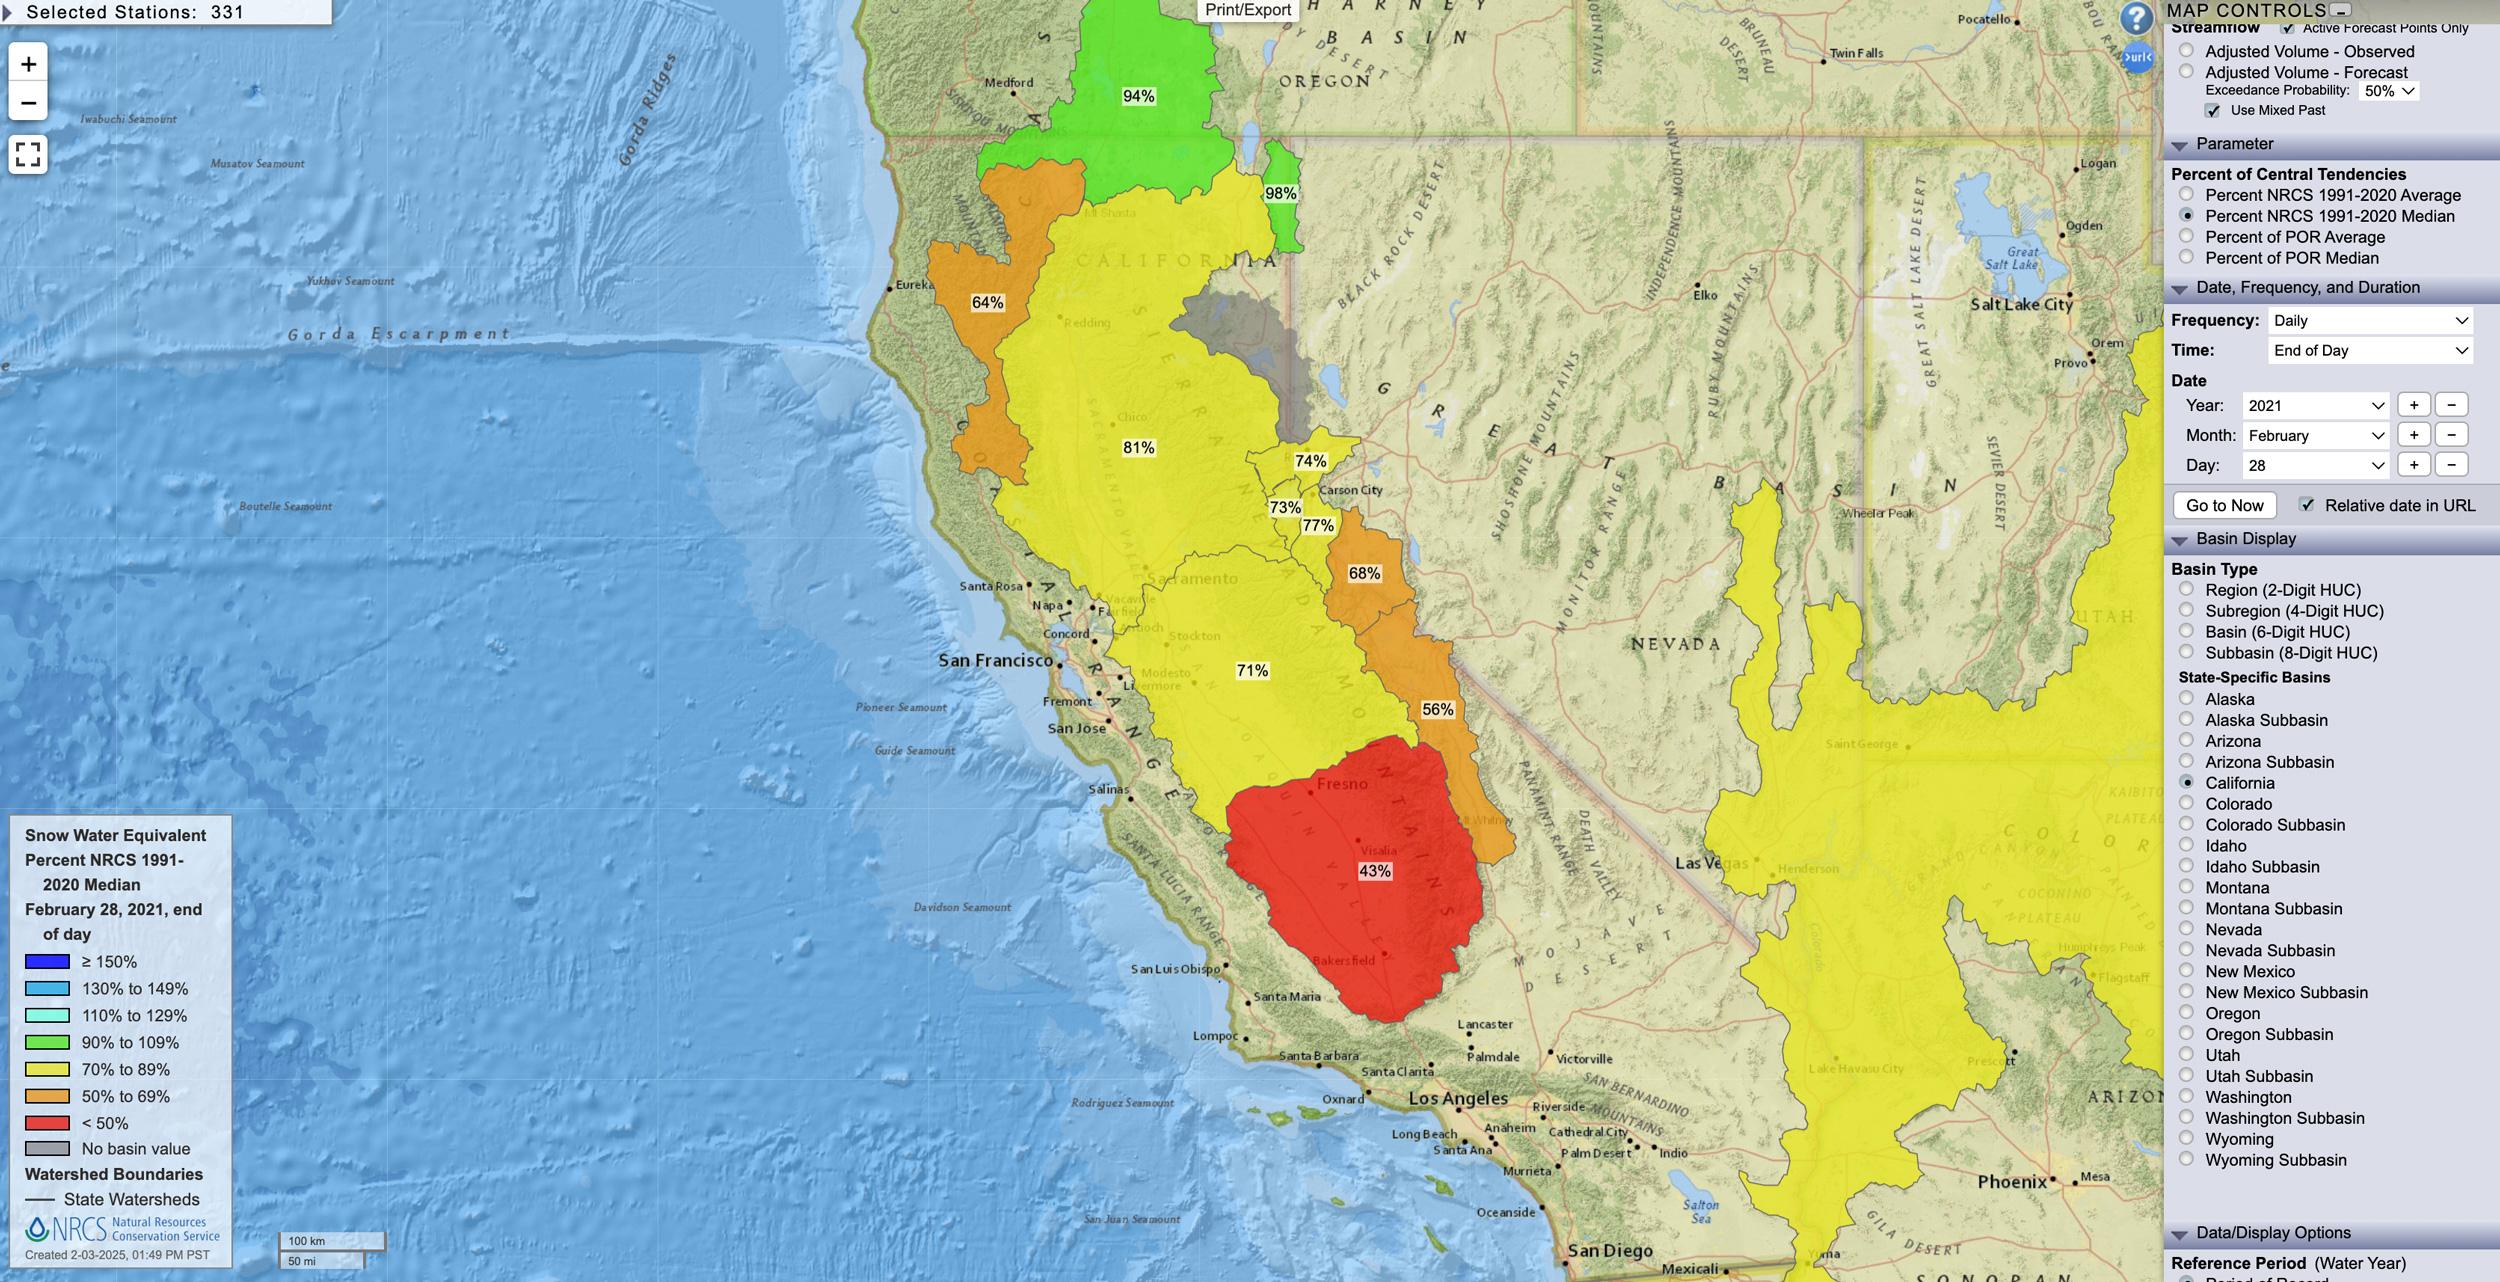
California February 28, 2021 snow water equivalent percent map.
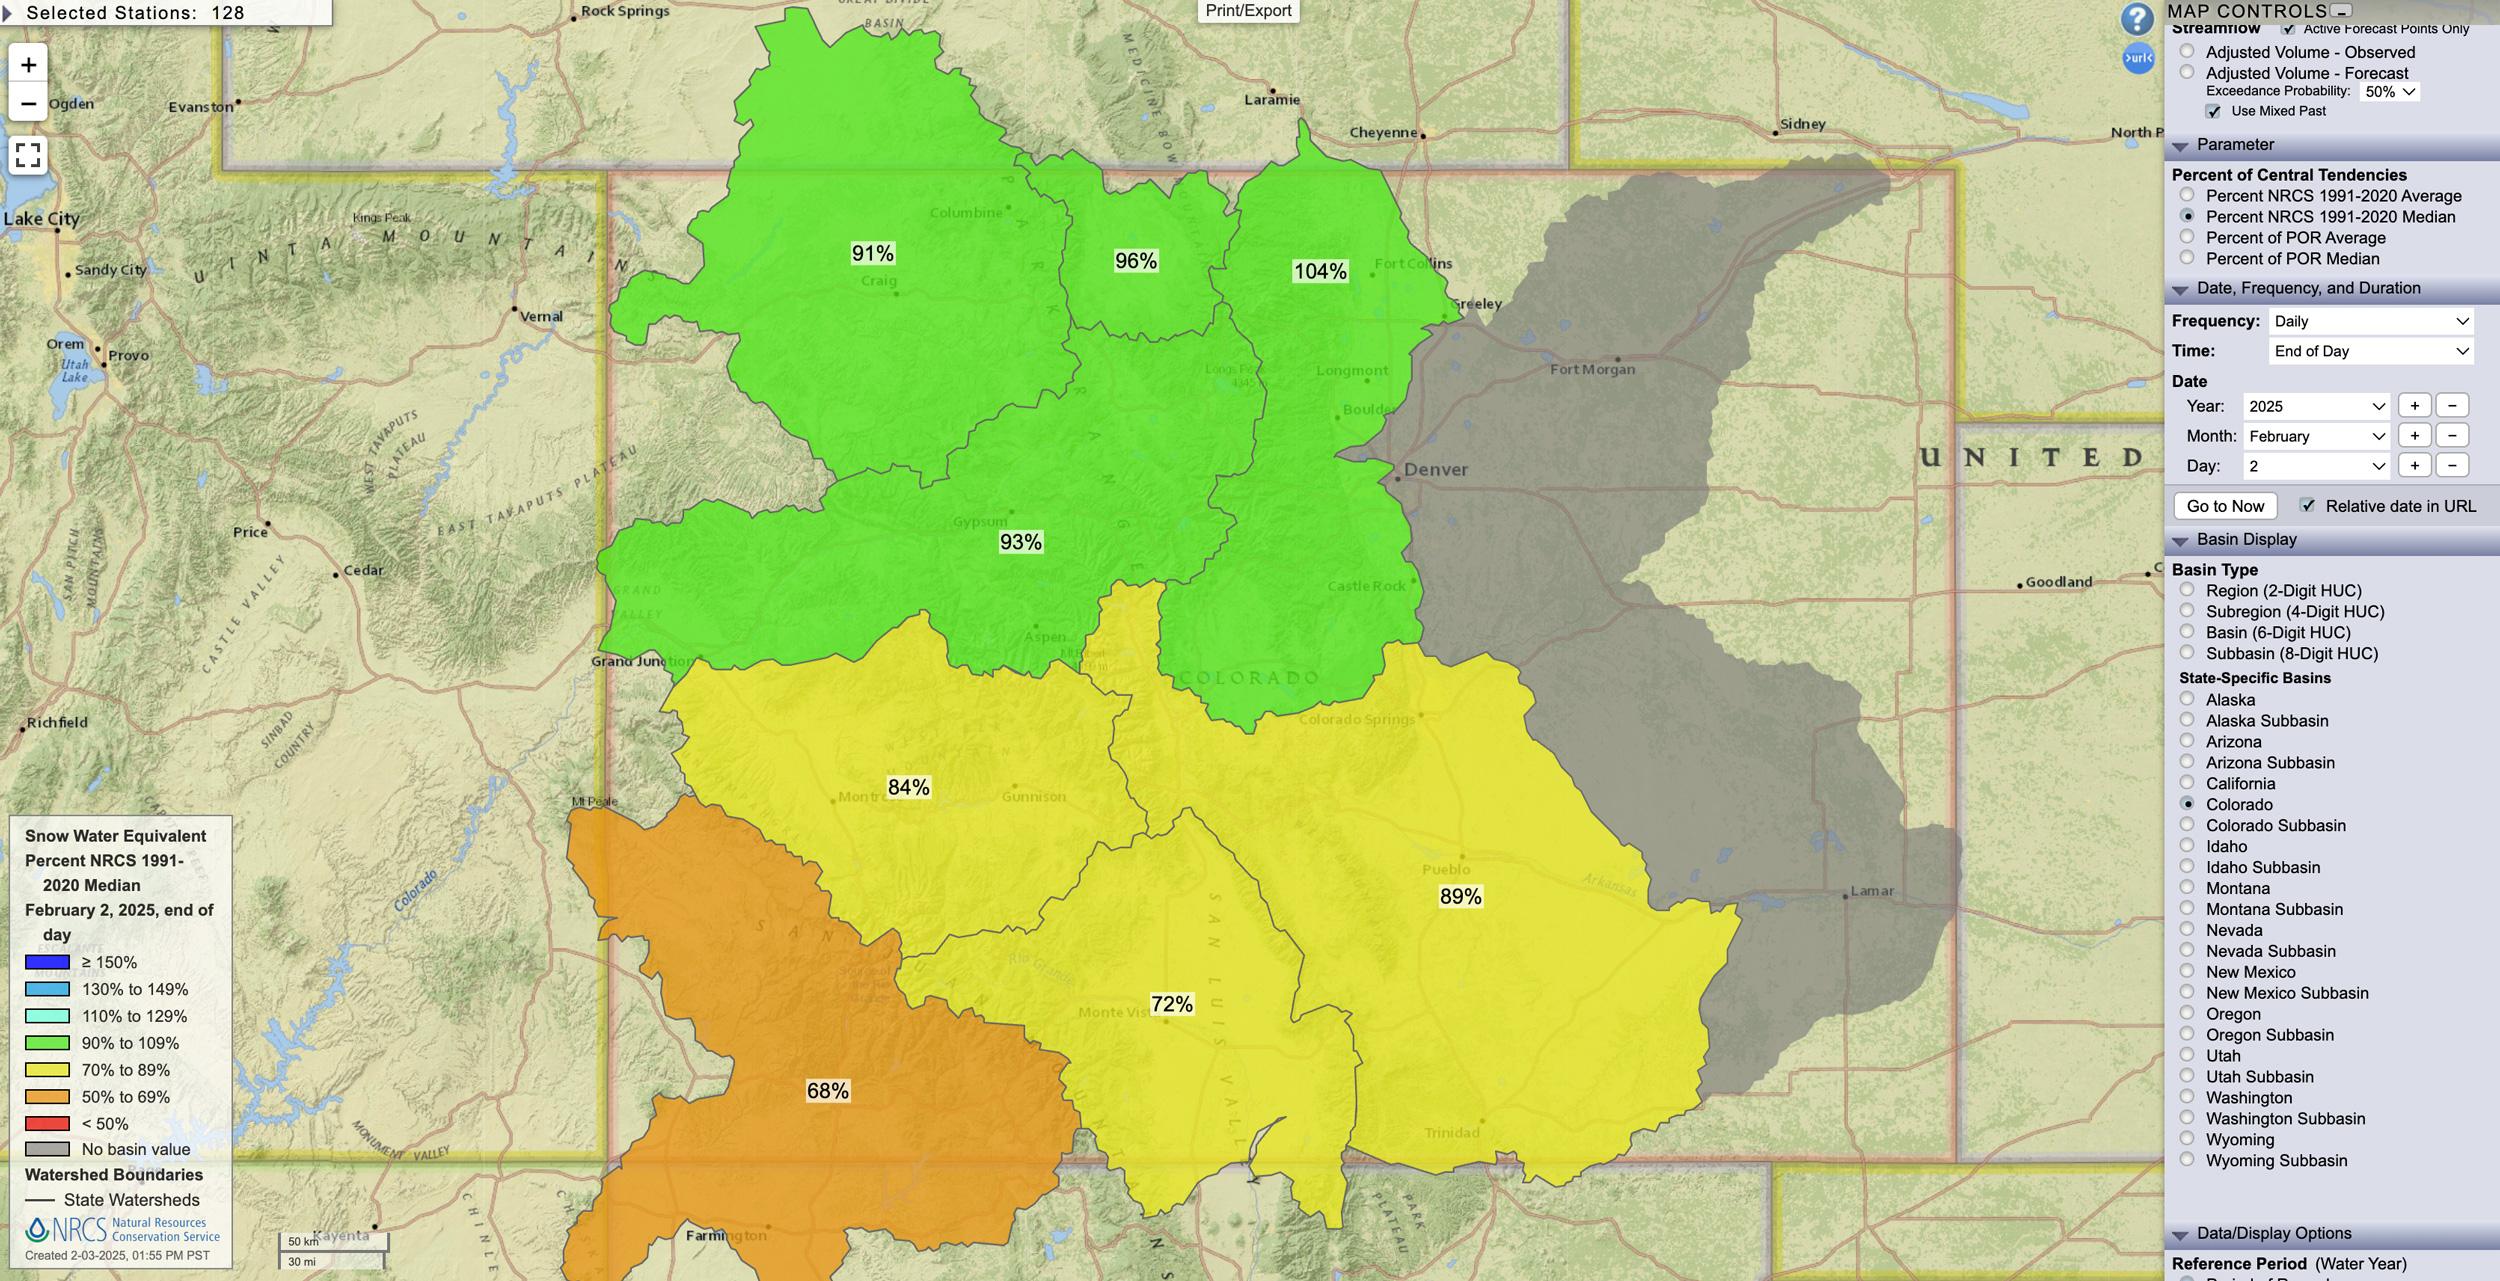
Colorado February 2, 2025 snow water equivalent percent map.
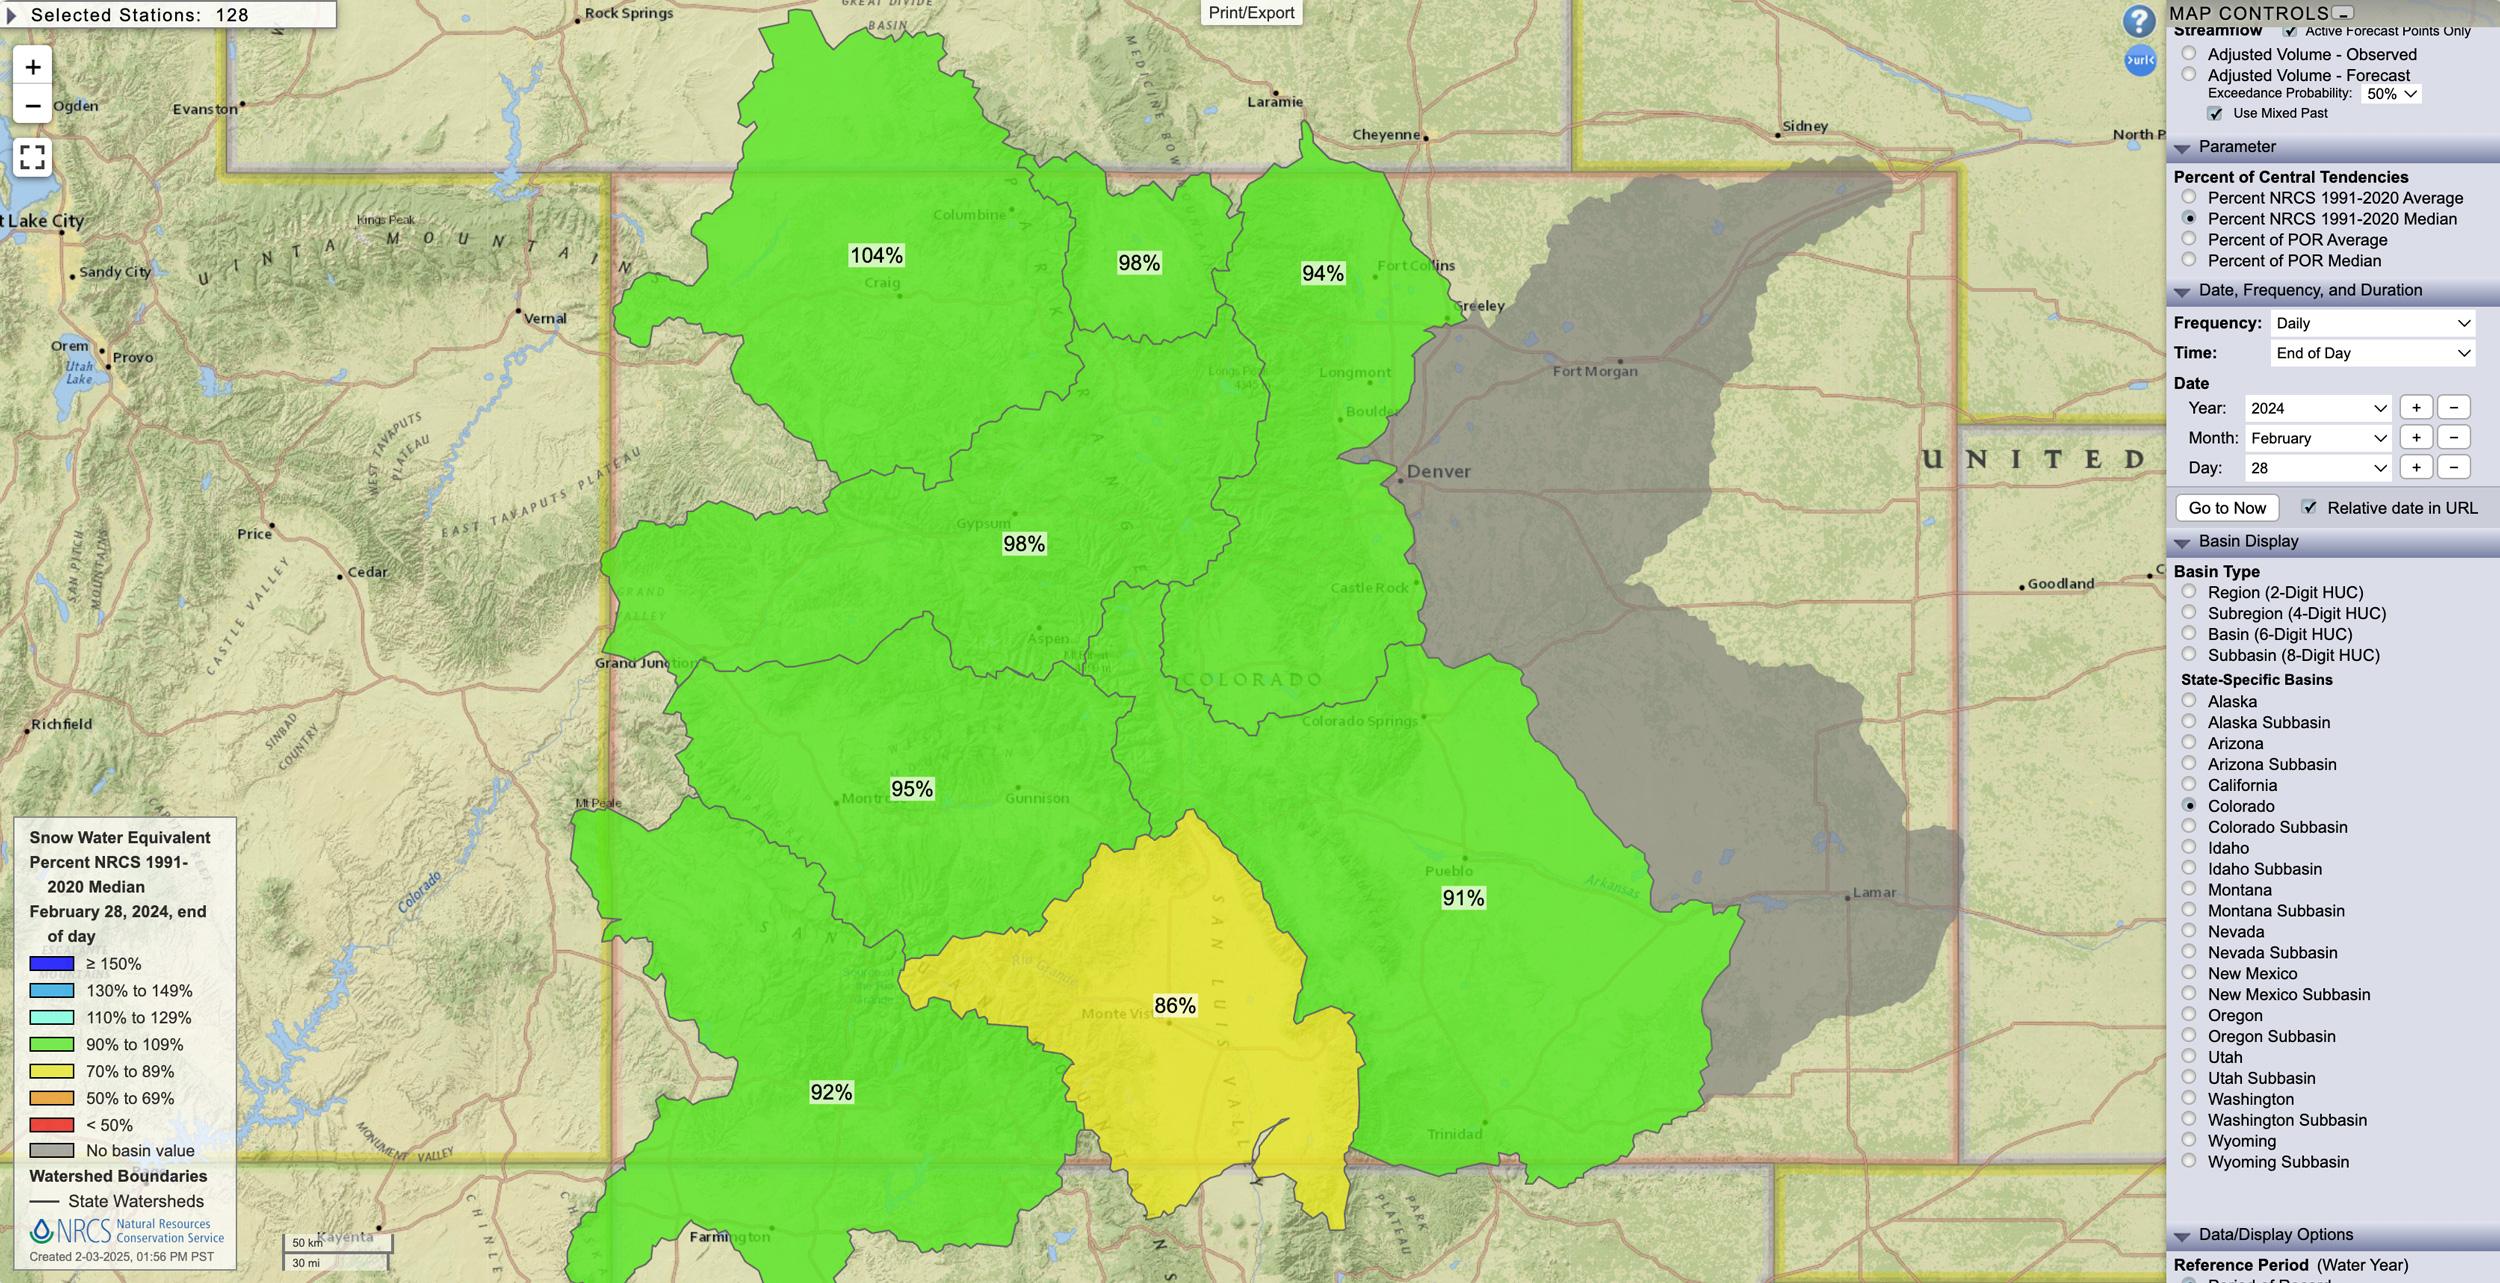
Colorado February 28, 2024 snow water equivalent percent map.
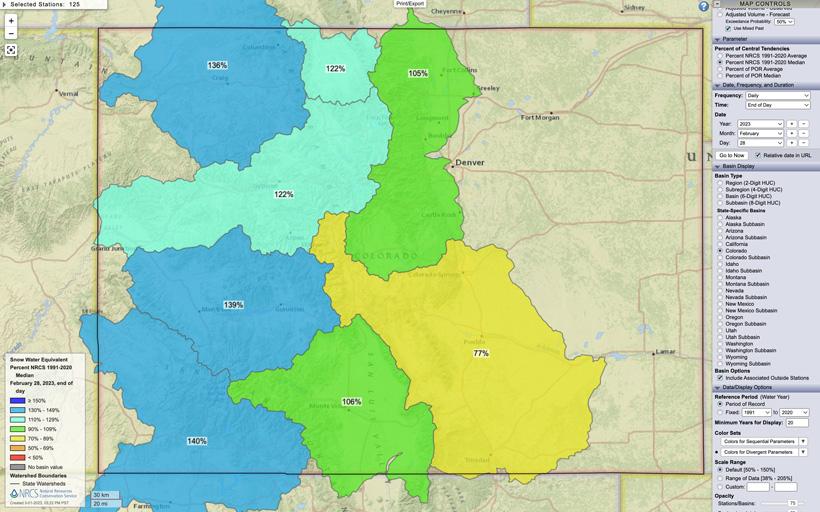
Colorado February 28, 2023 snow water equivalent percent map.
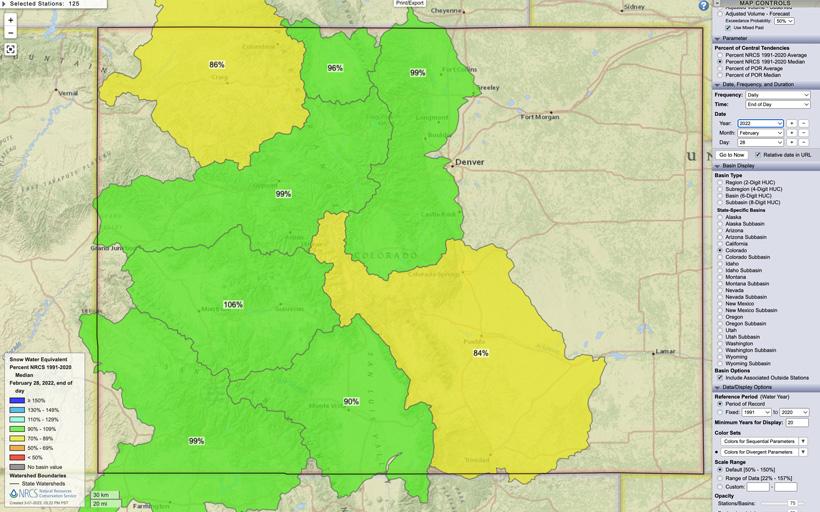
Colorado February 28, 2022 snow water equivalent percent map.
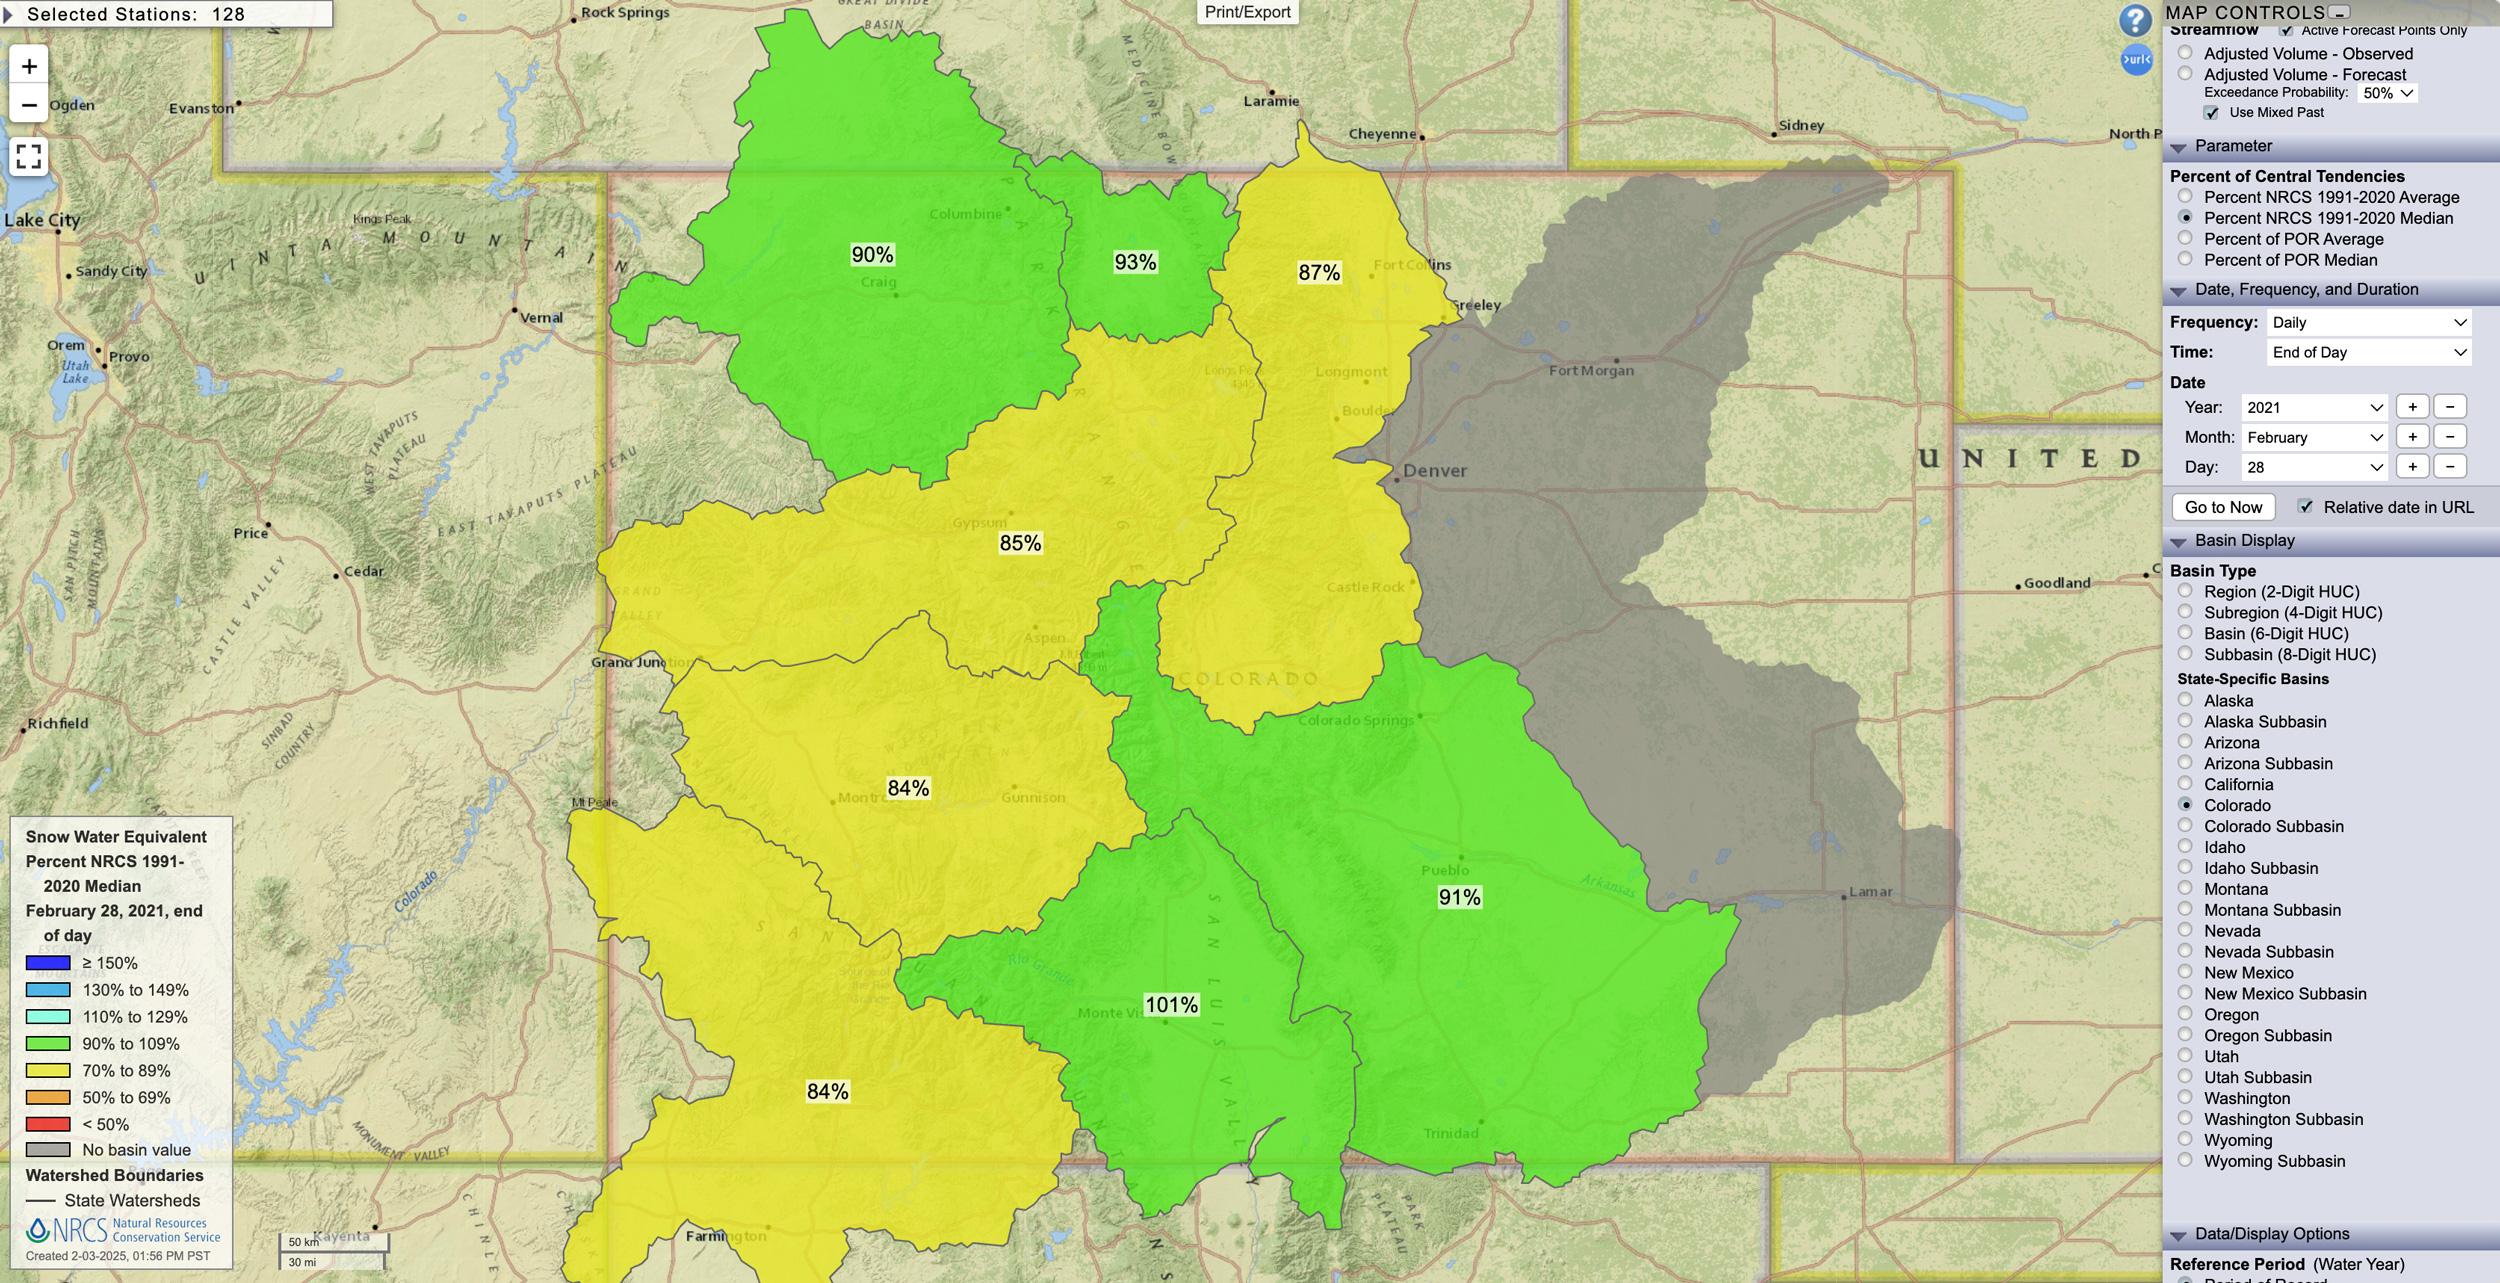
Colorado February 28, 2021 snow water equivalent percent map.
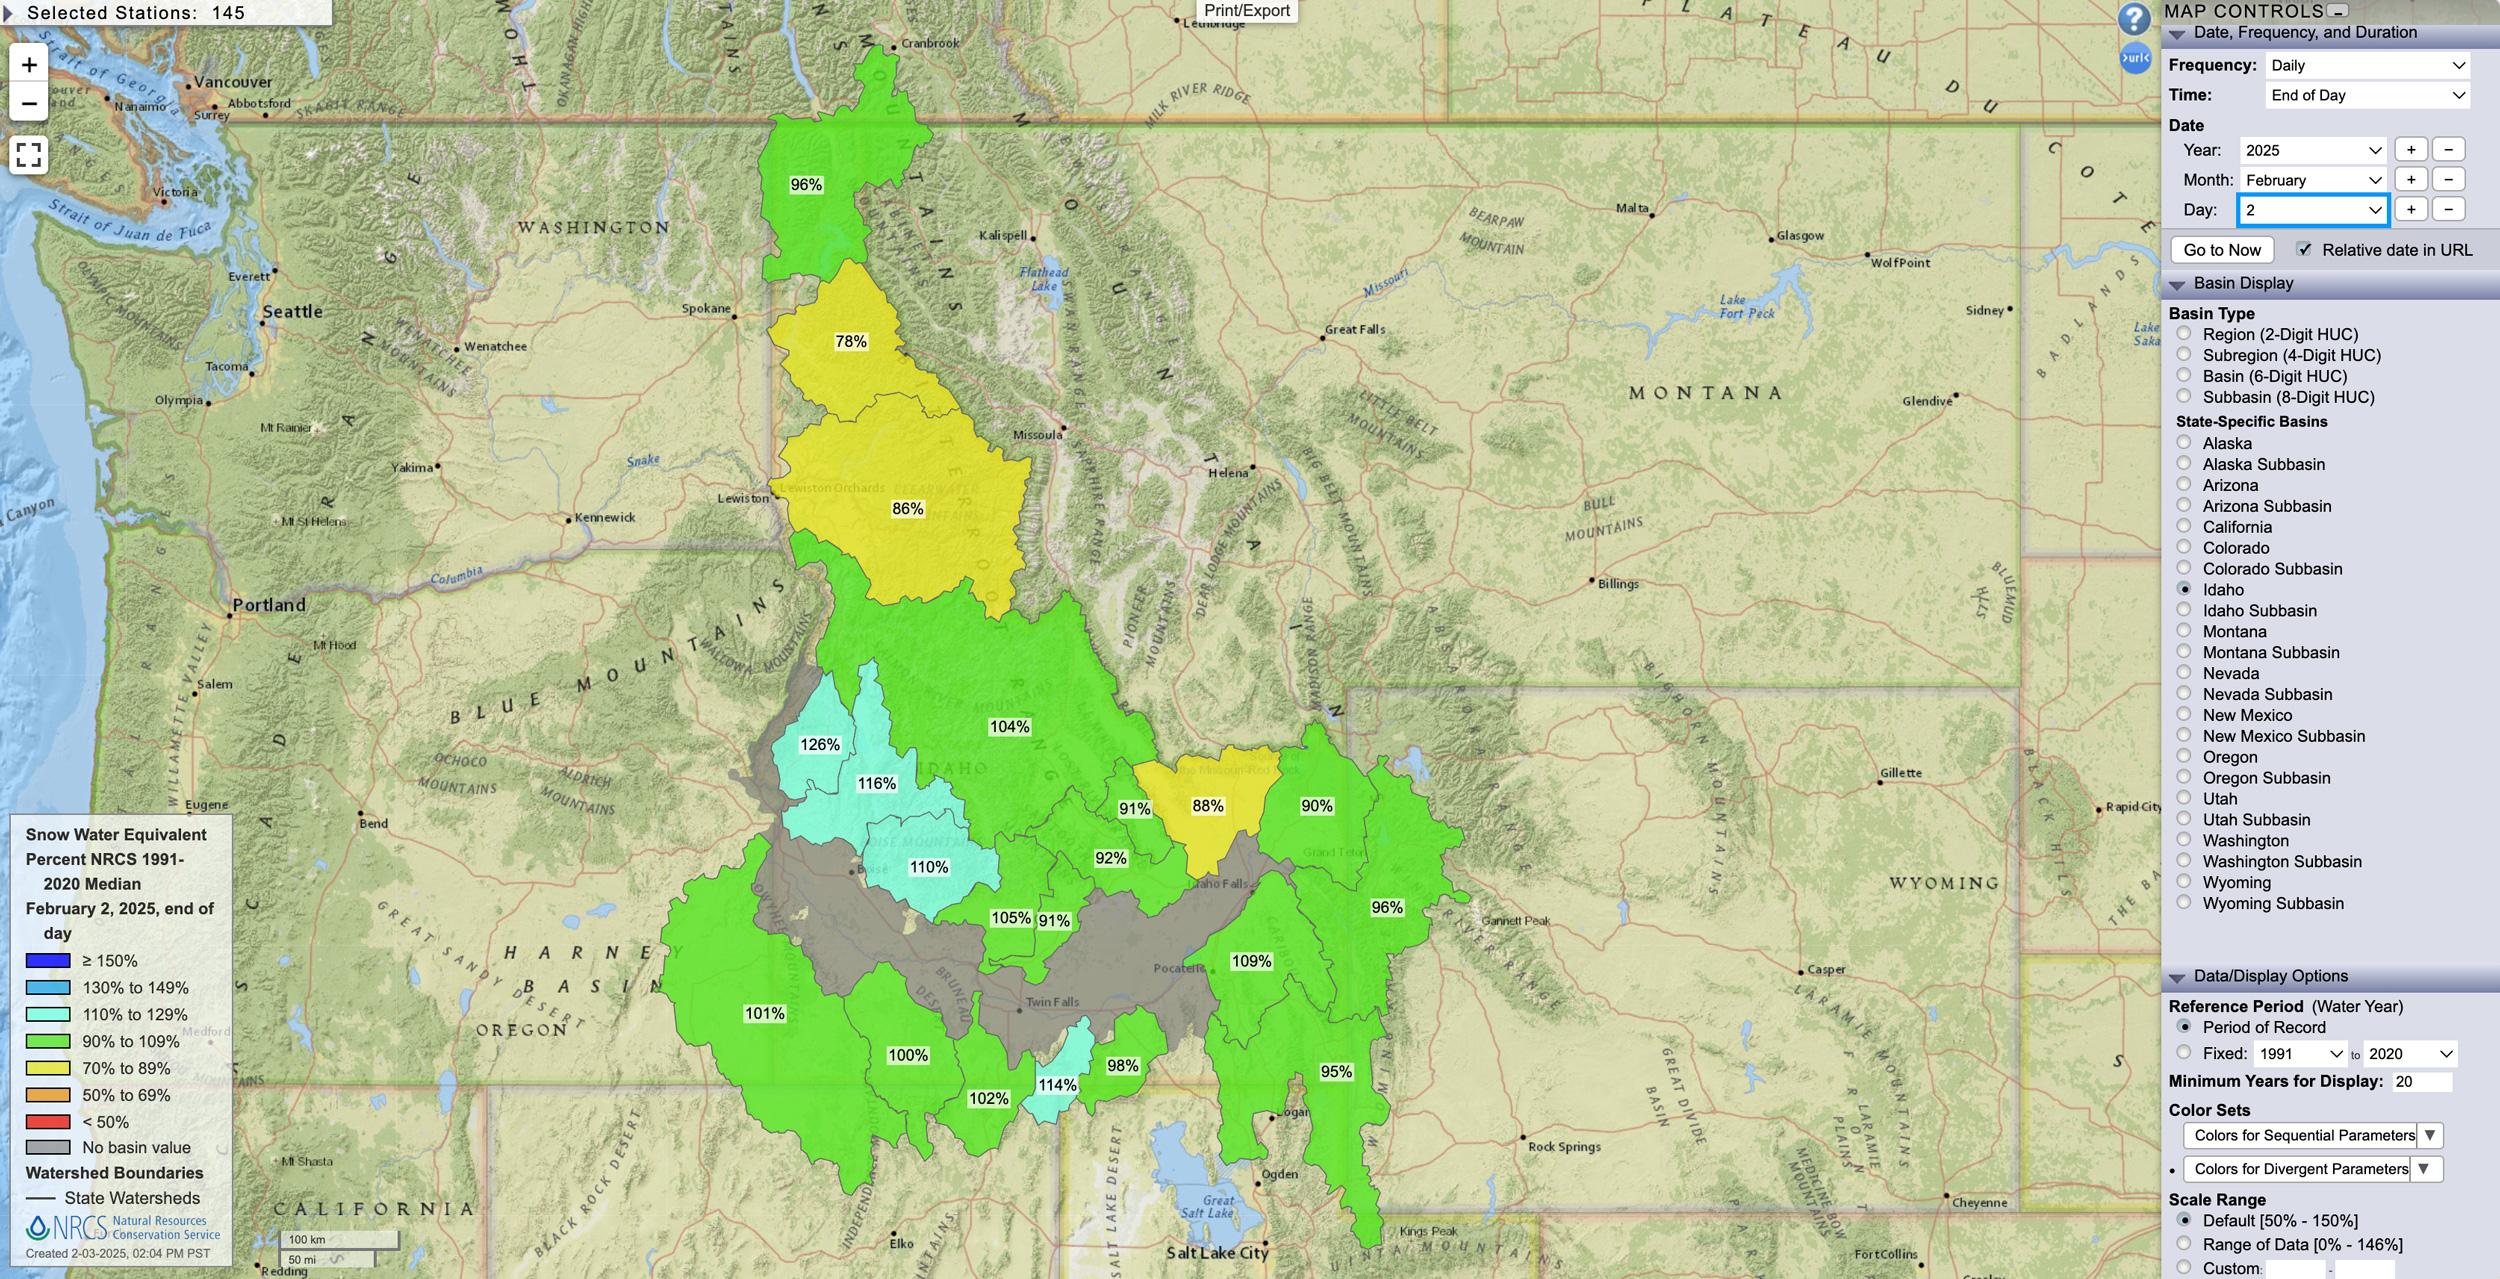
Idaho February 2, 2025 snow water equivalent percent map.
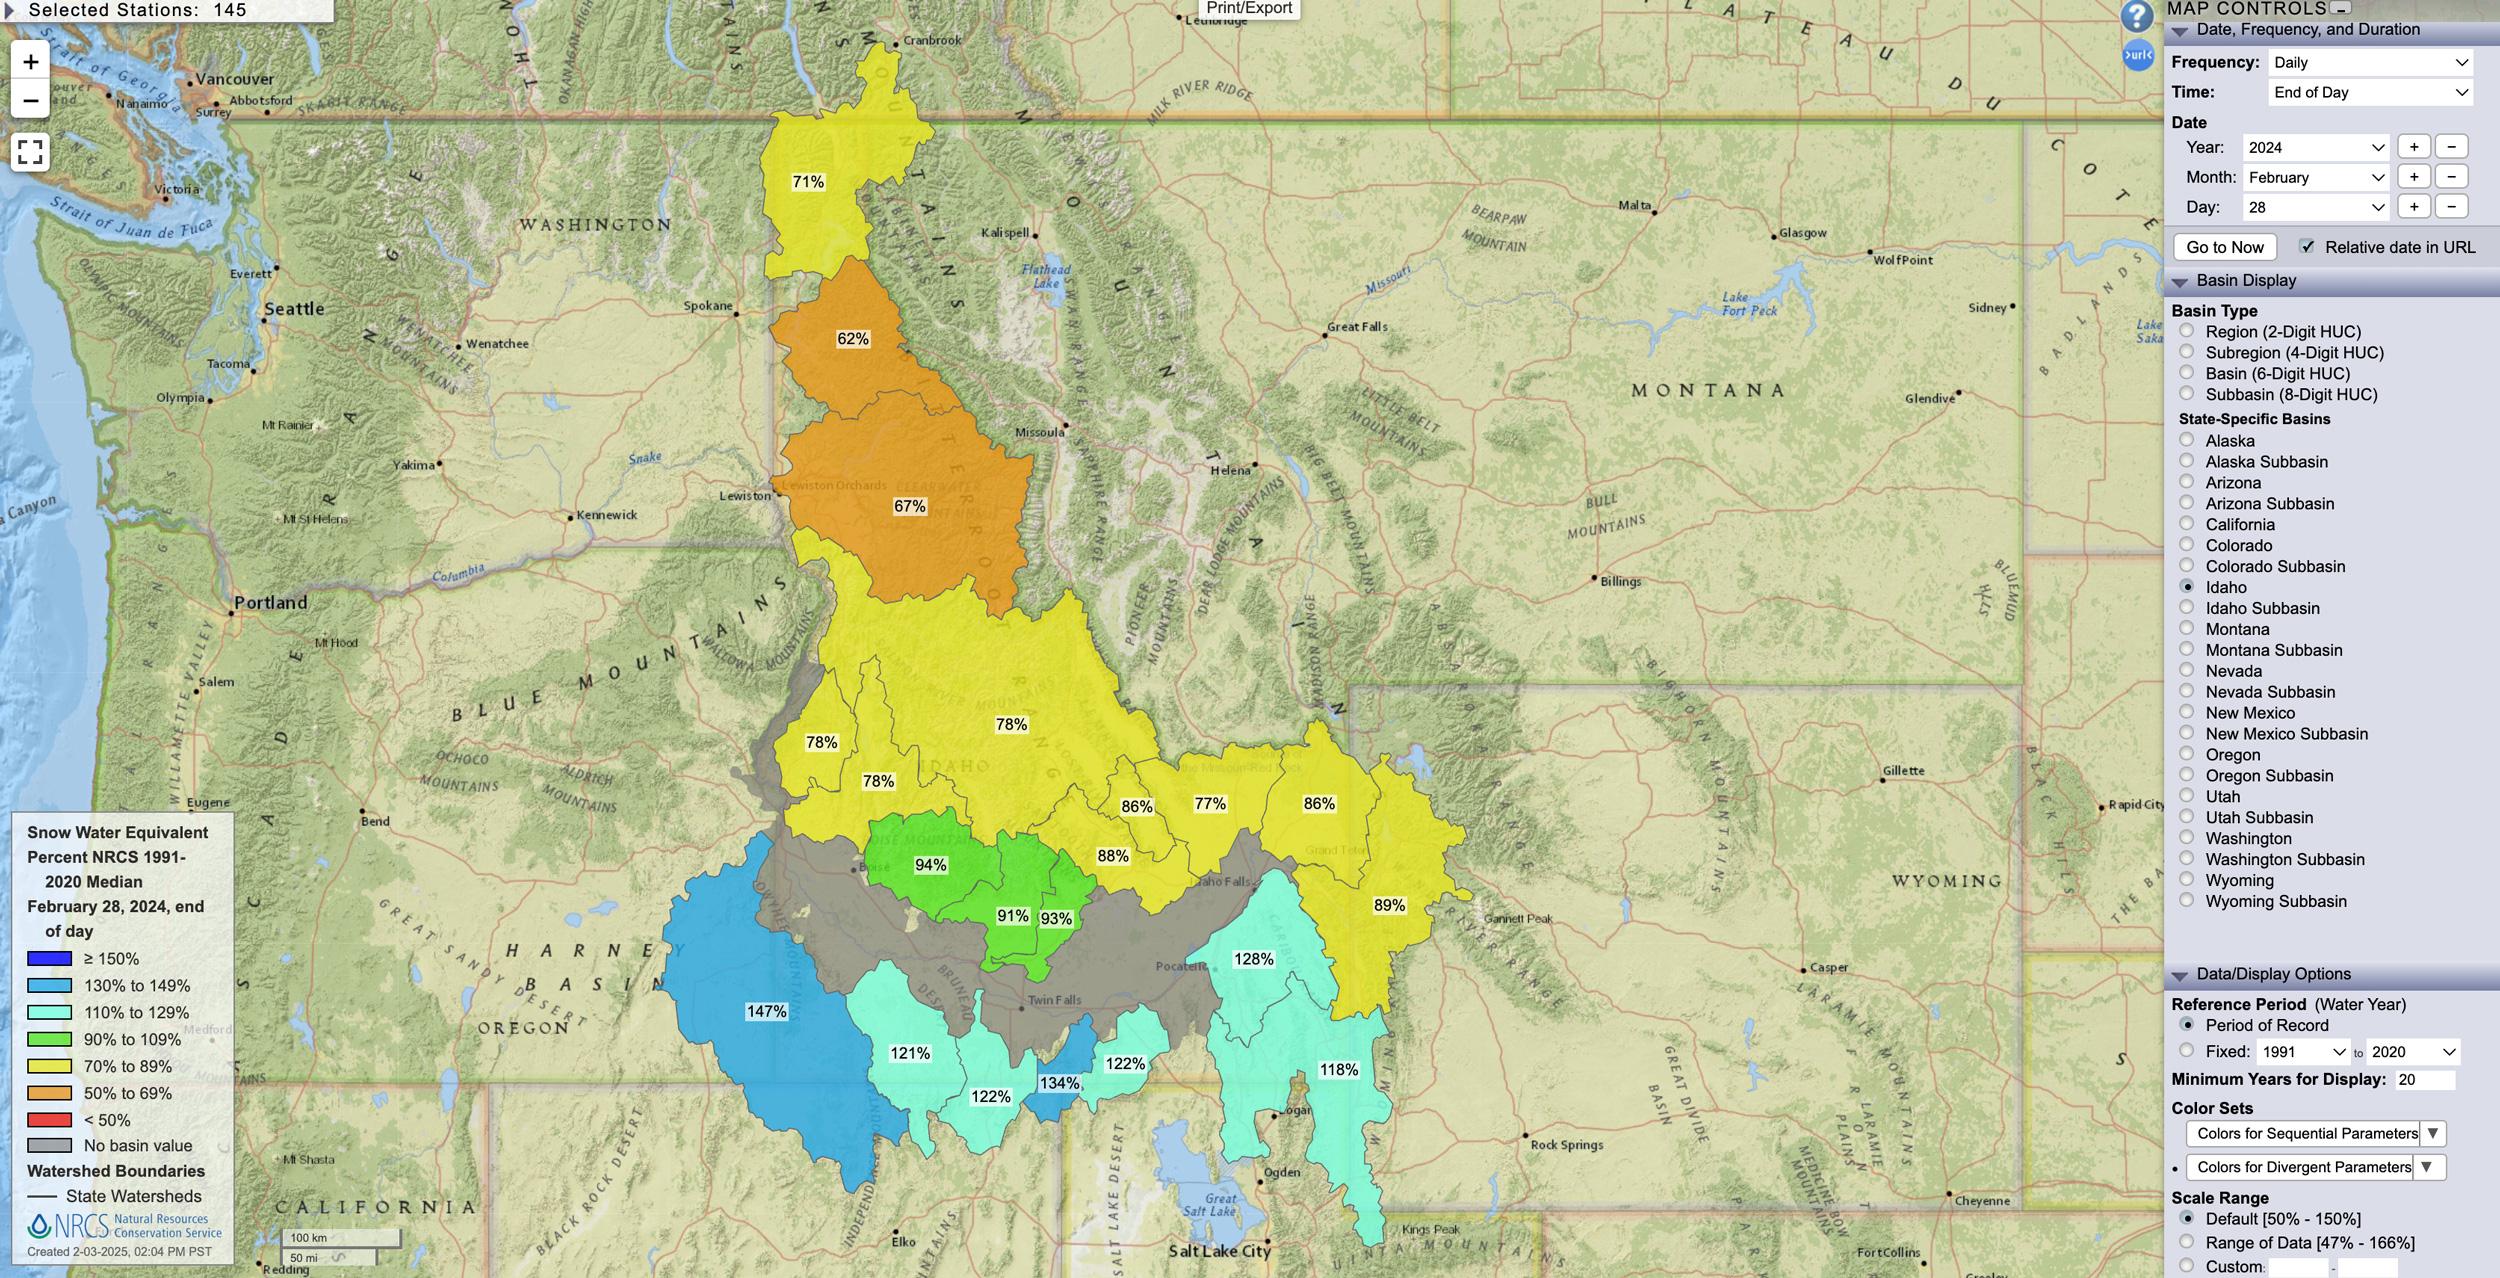
Idaho February 28, 2024 snow water equivalent percent map.
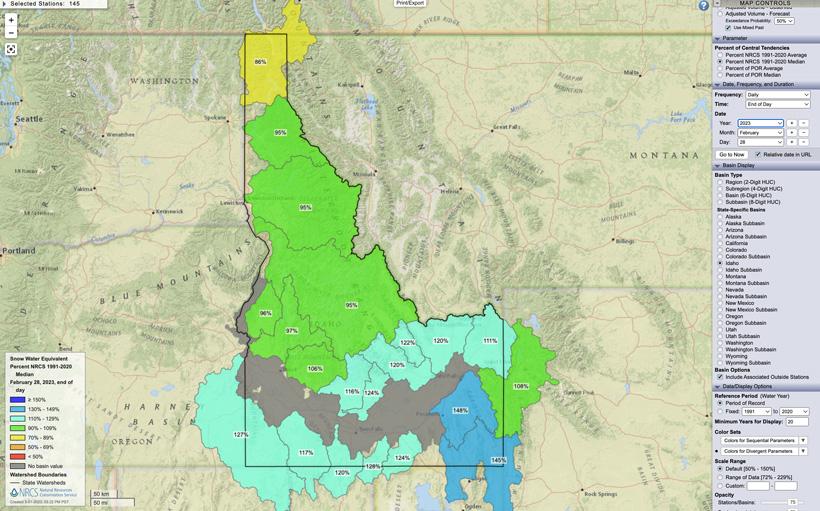
Idaho February 28, 2023 snow water equivalent percent map.
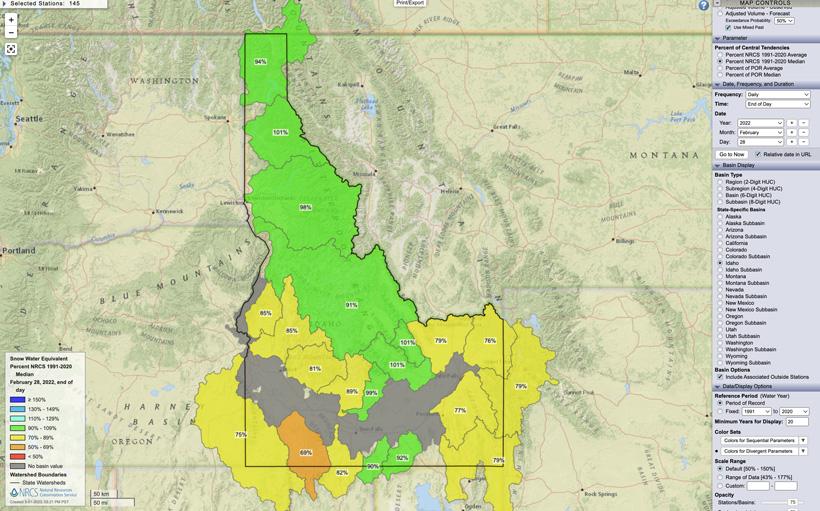
Idaho February 28, 2022 snow water equivalent percent map.
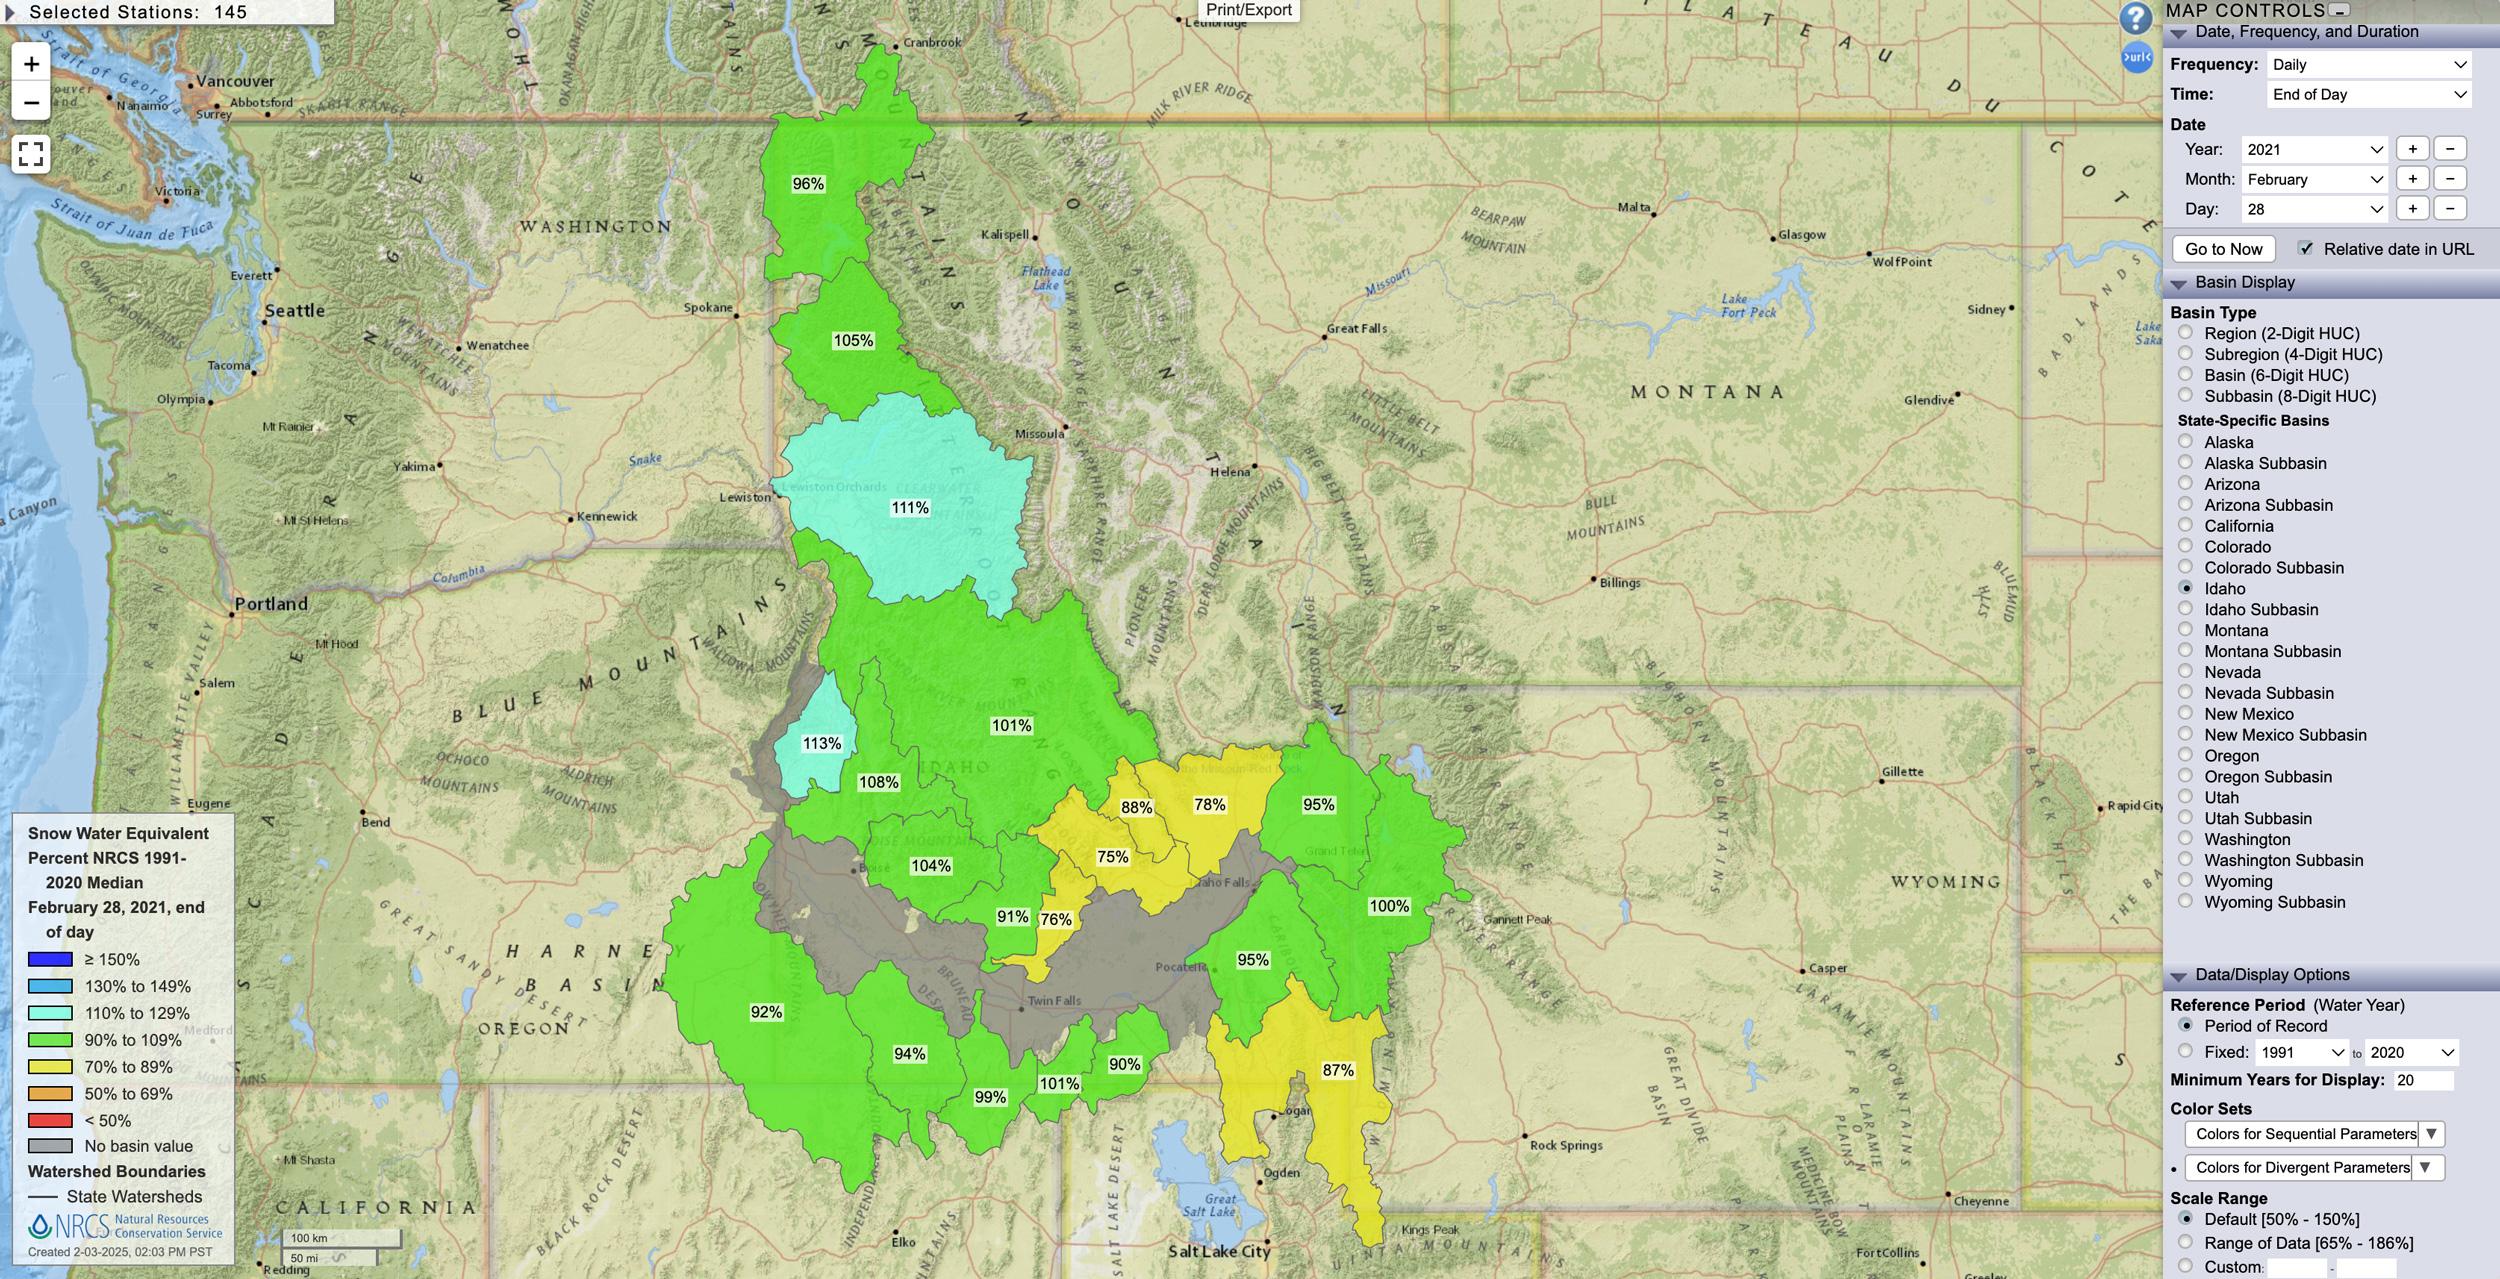
Idaho February 28, 2021 snow water equivalent percent map.
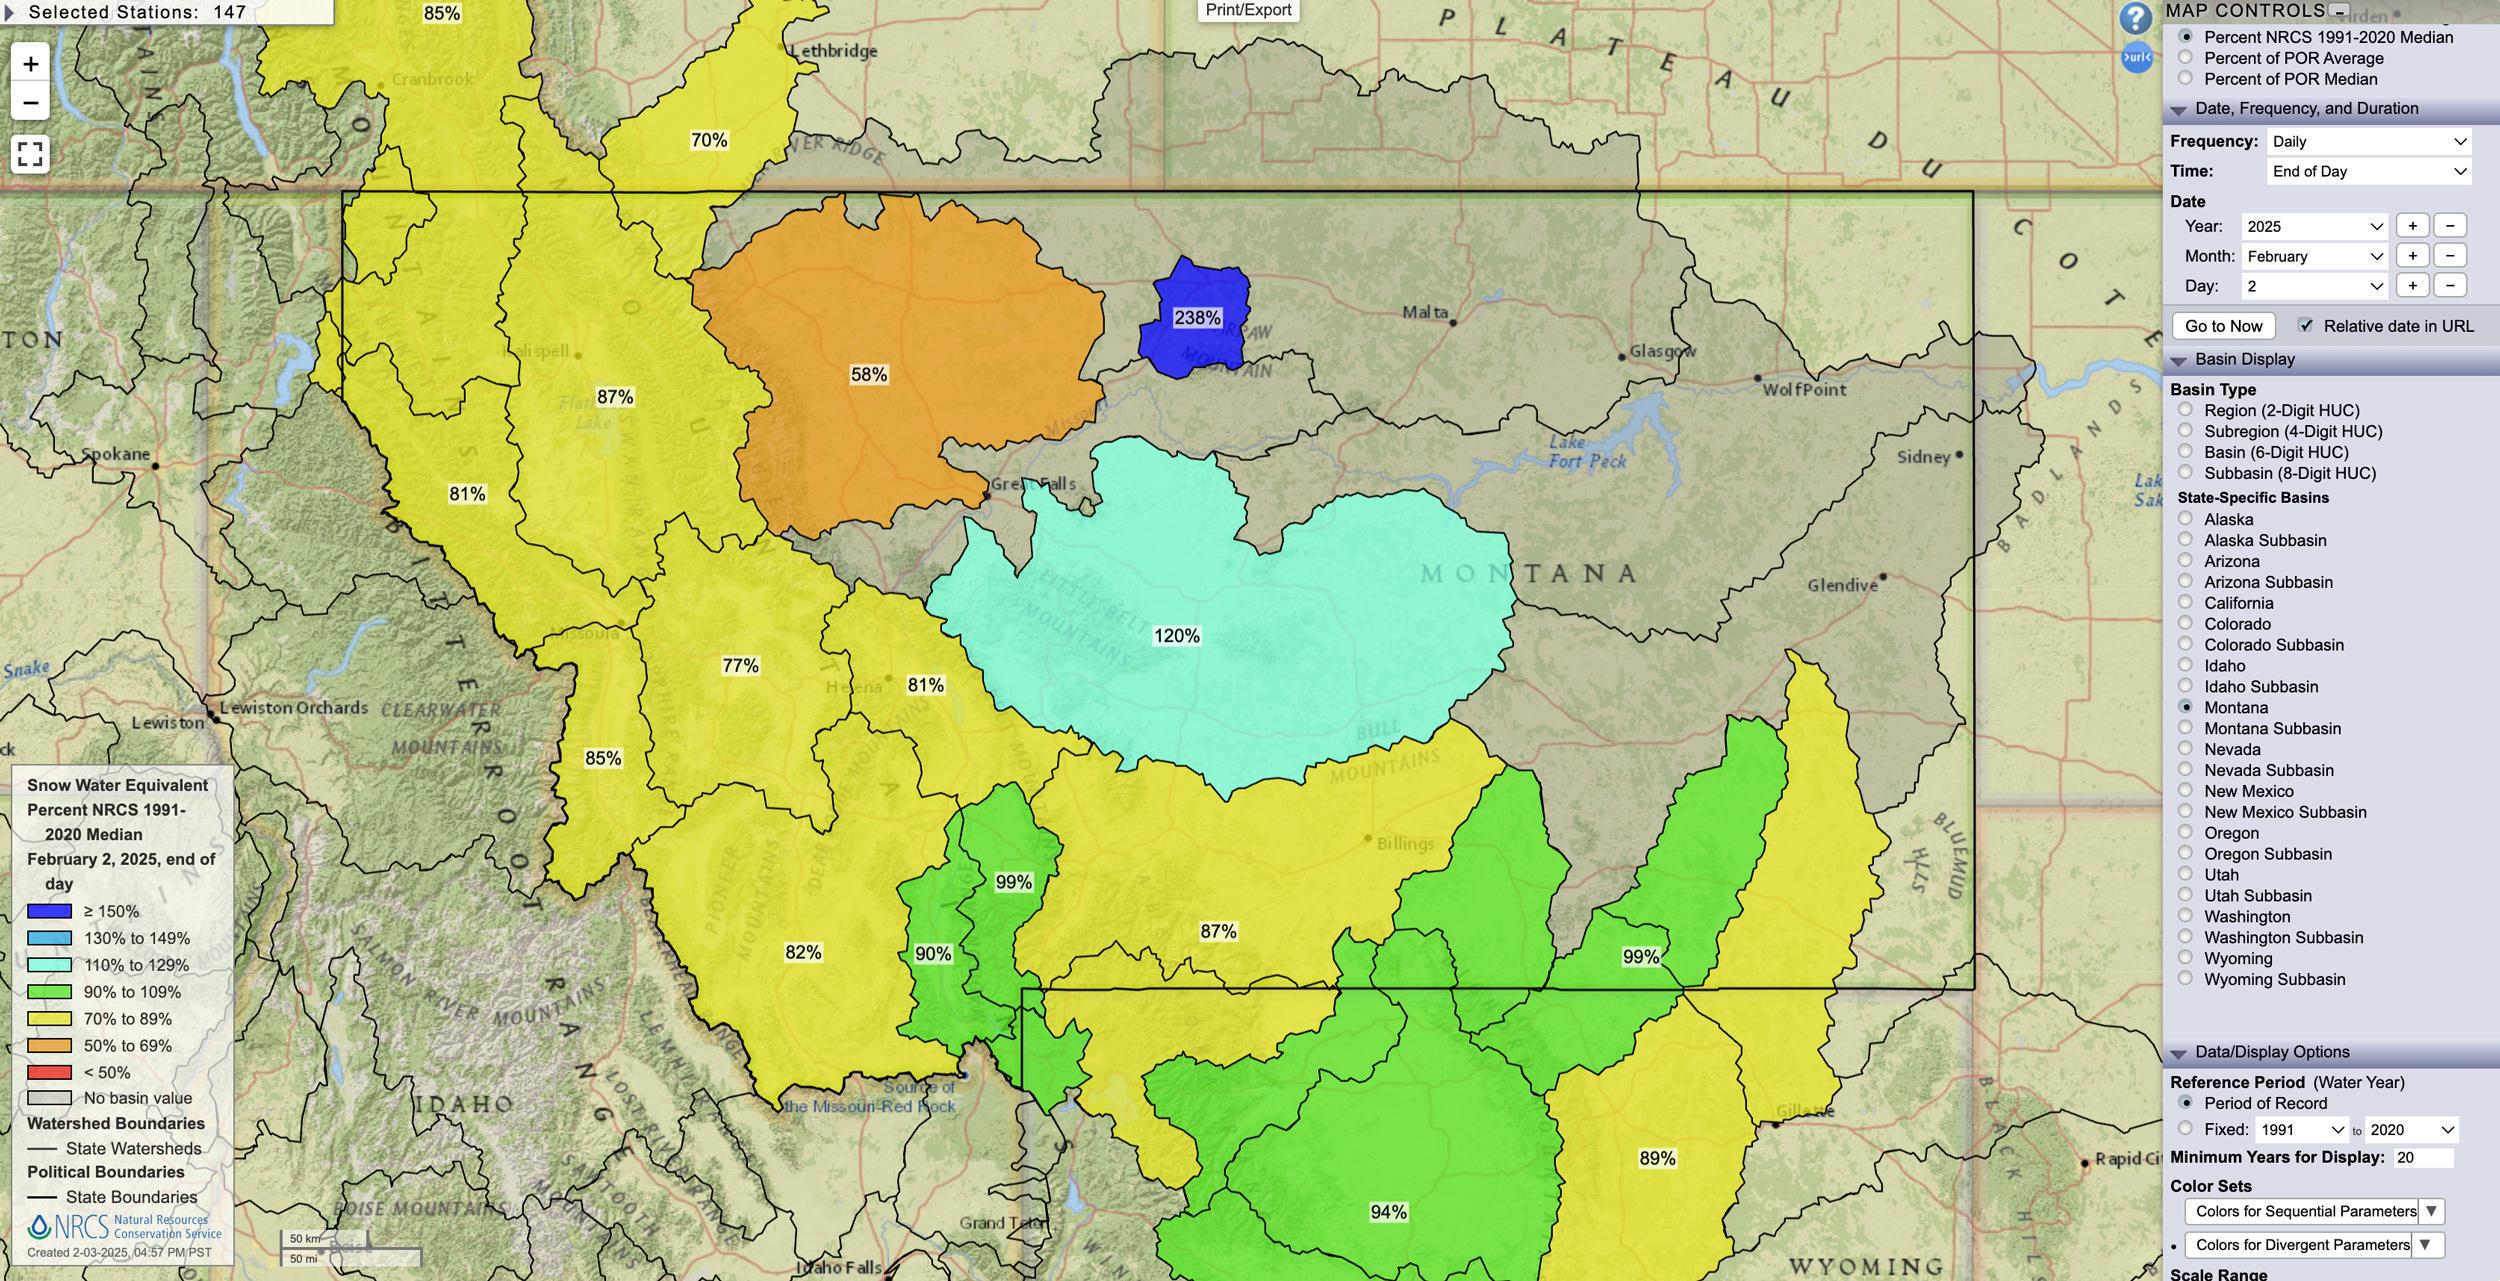
Montana February 2, 2025 snow water equivalent percent map.
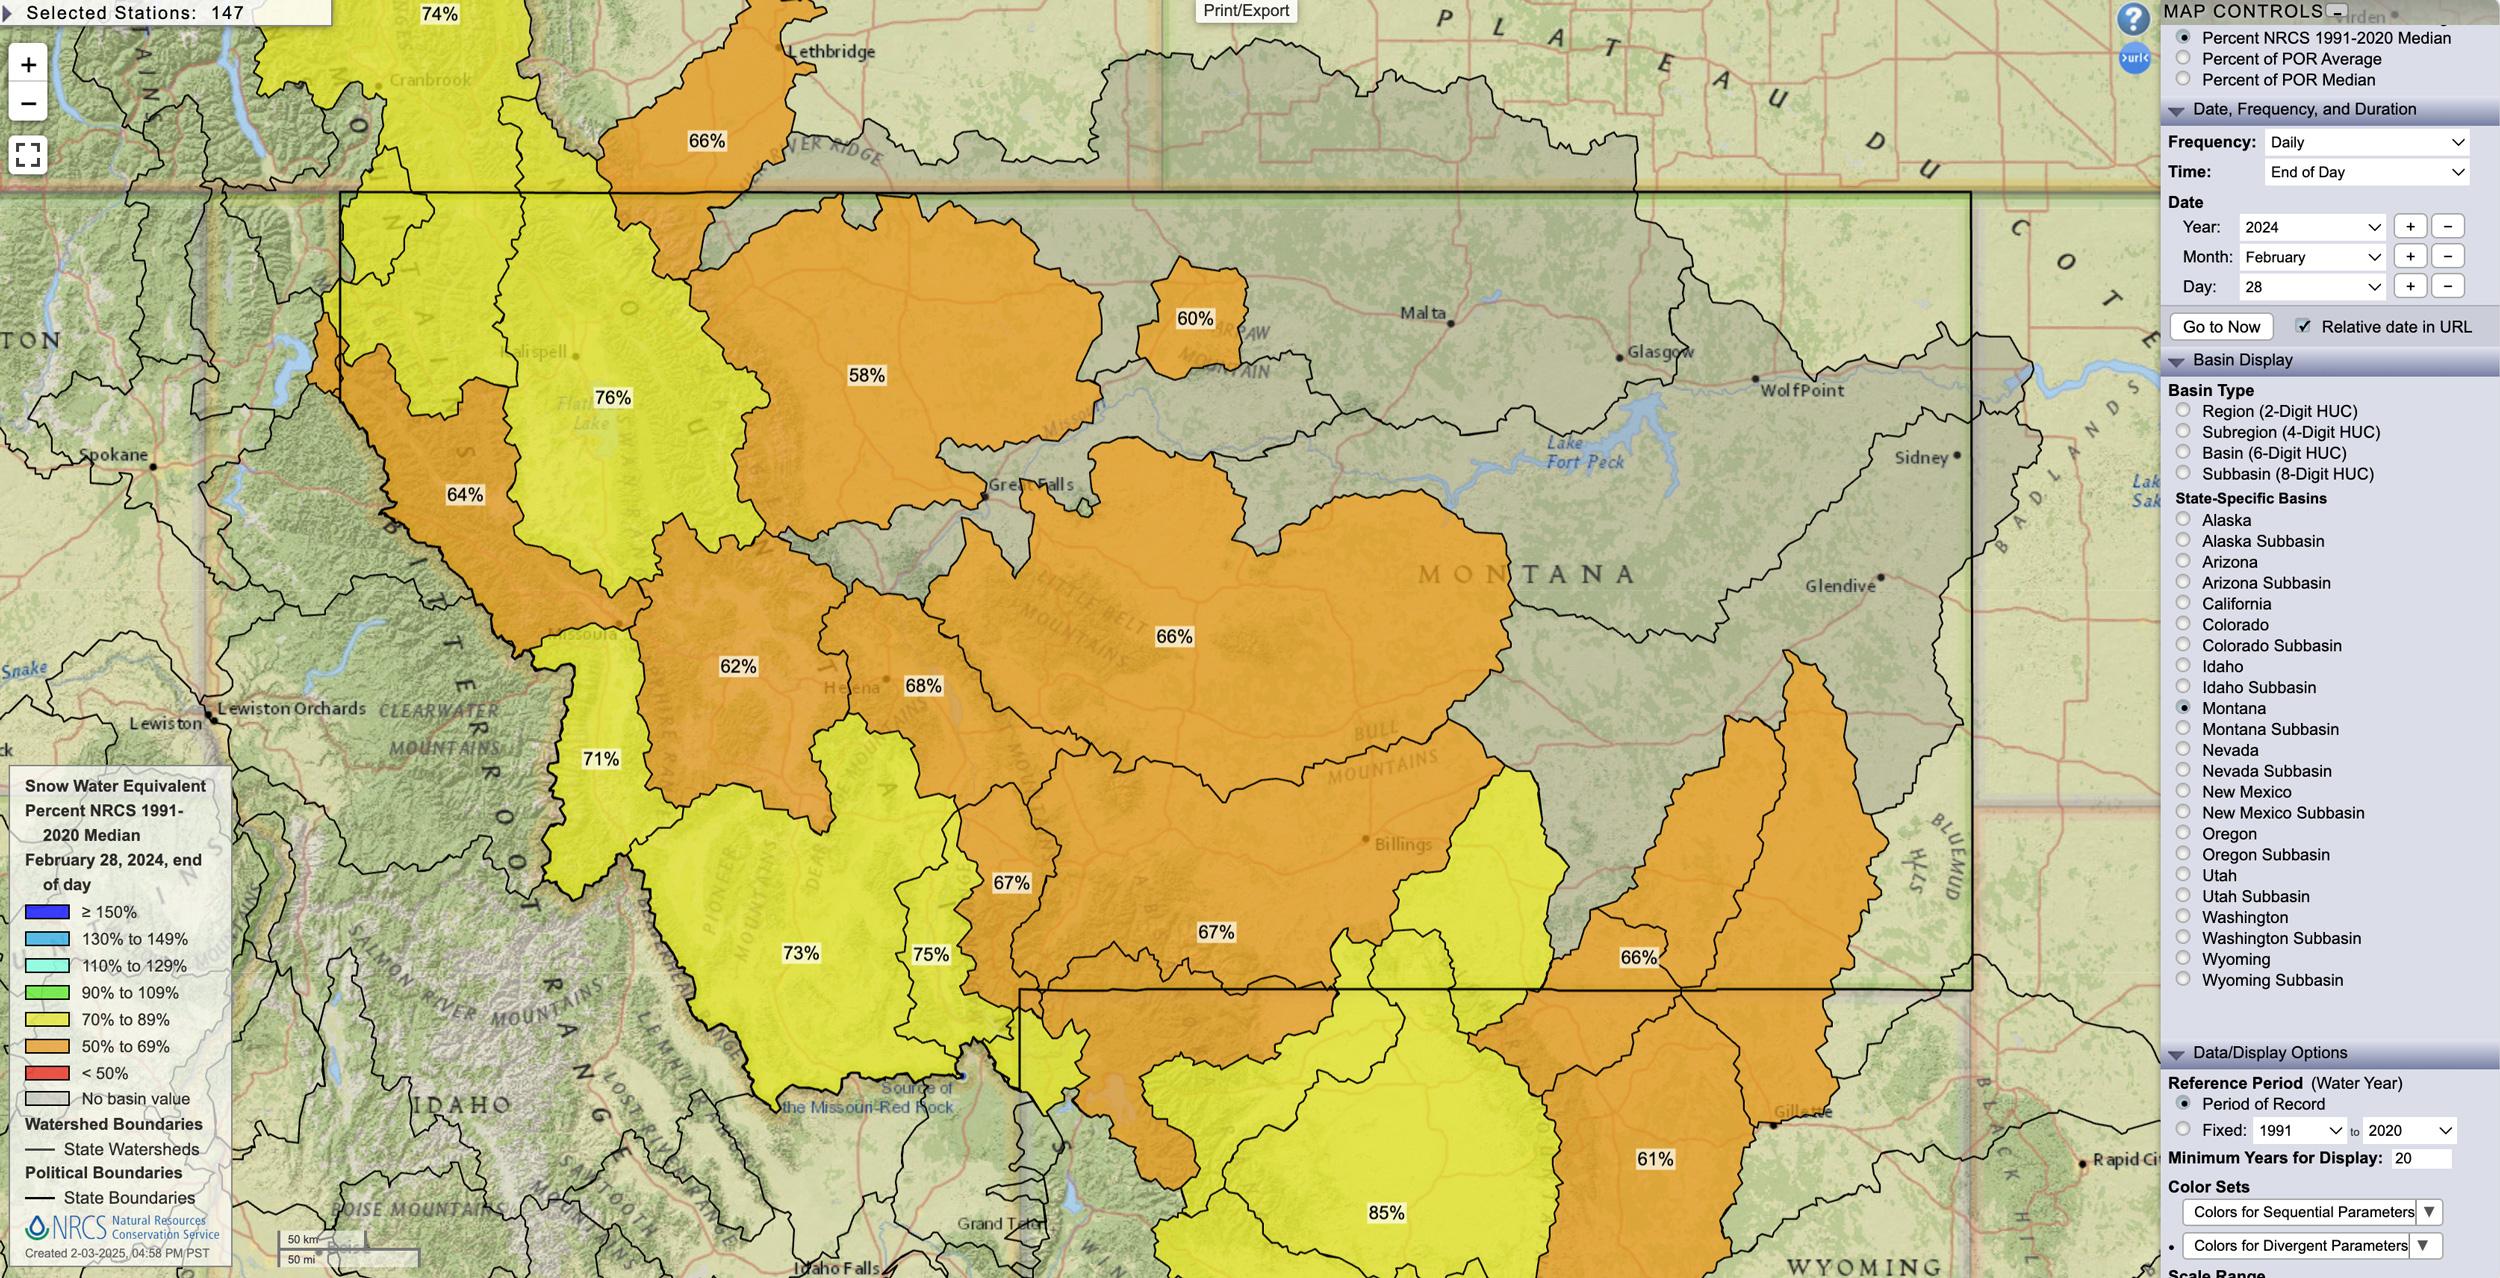
Montana February 28, 2024 snow water equivalent percent map.
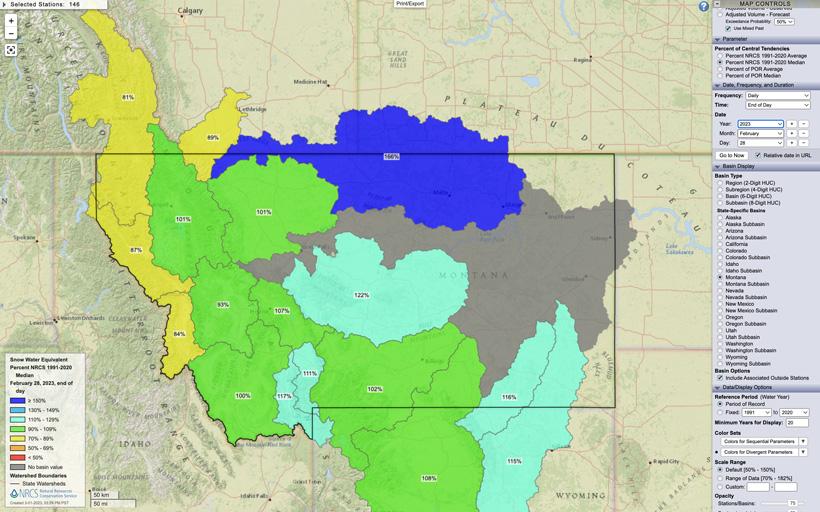
Montana February 28, 2023 snow water equivalent percent map
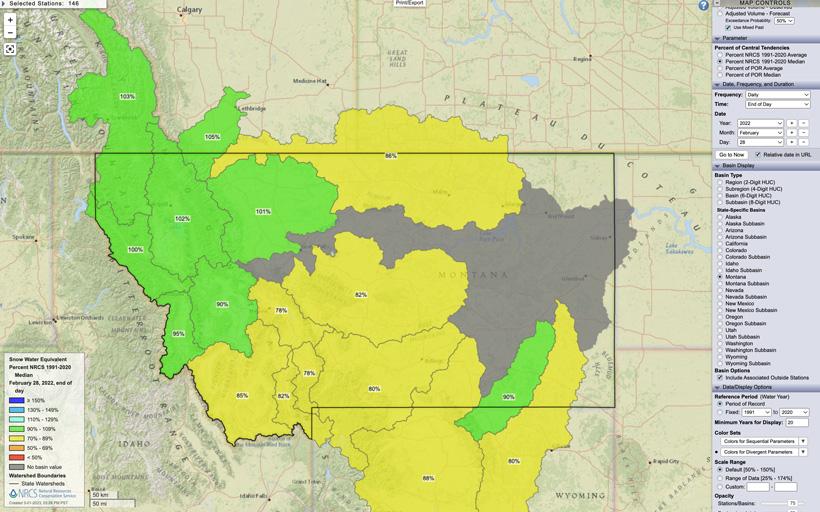
Montana February 28, 2022 snow water equivalent percent map
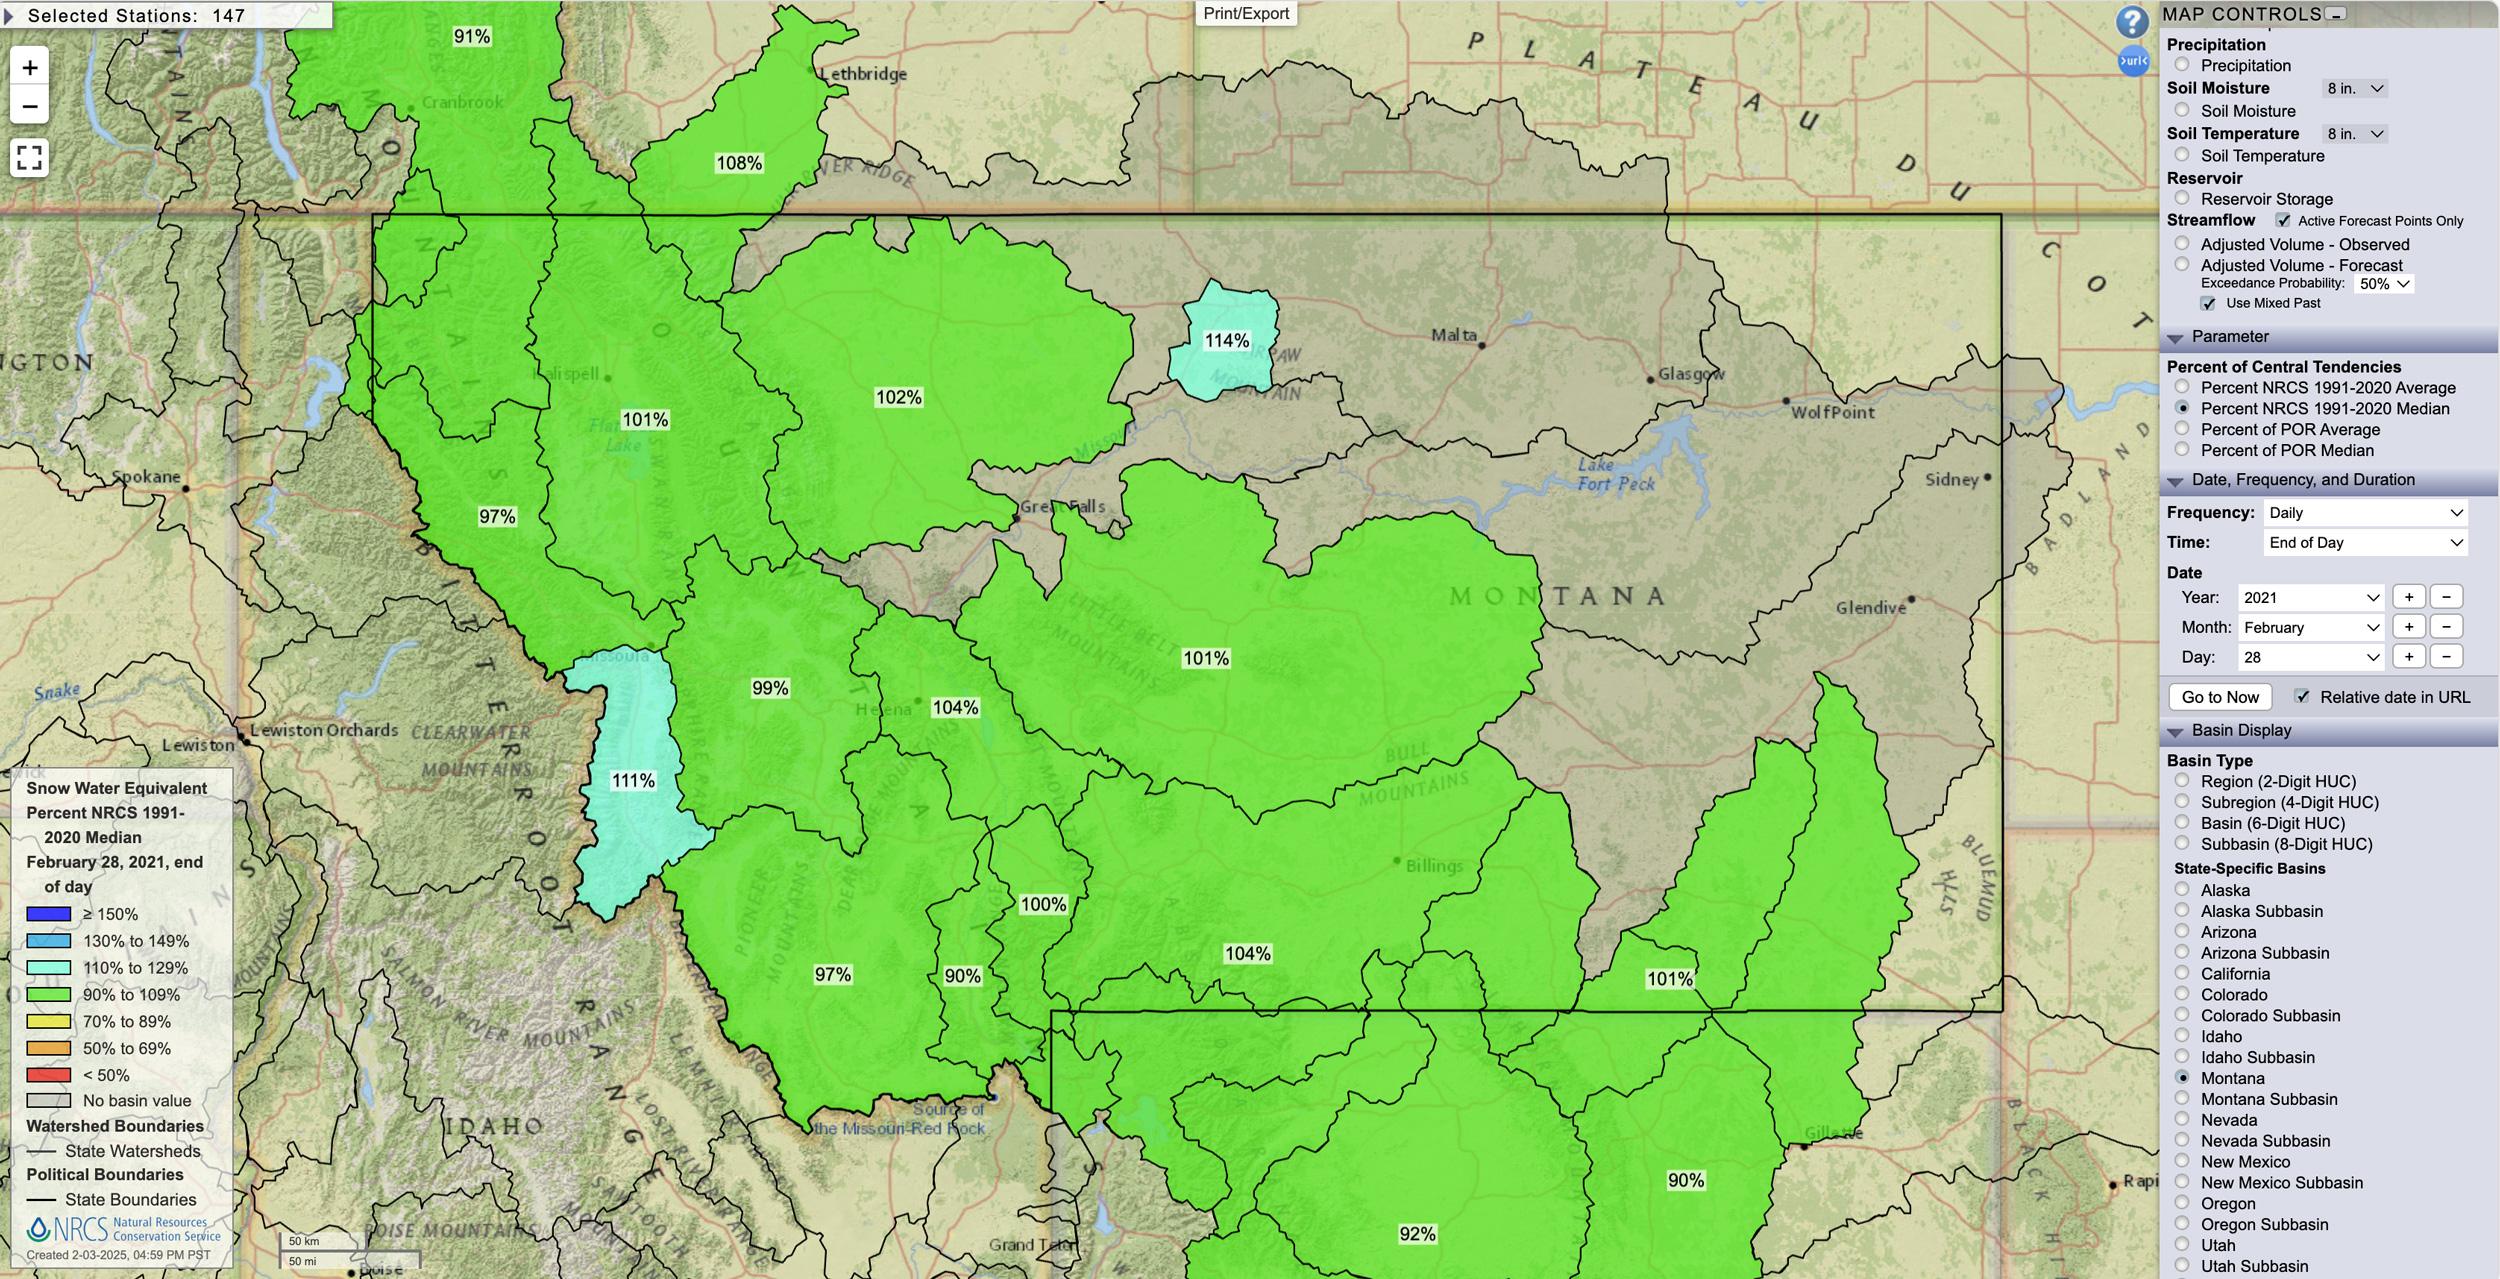
Montana February 28, 2021 snow water equivalent percent map.
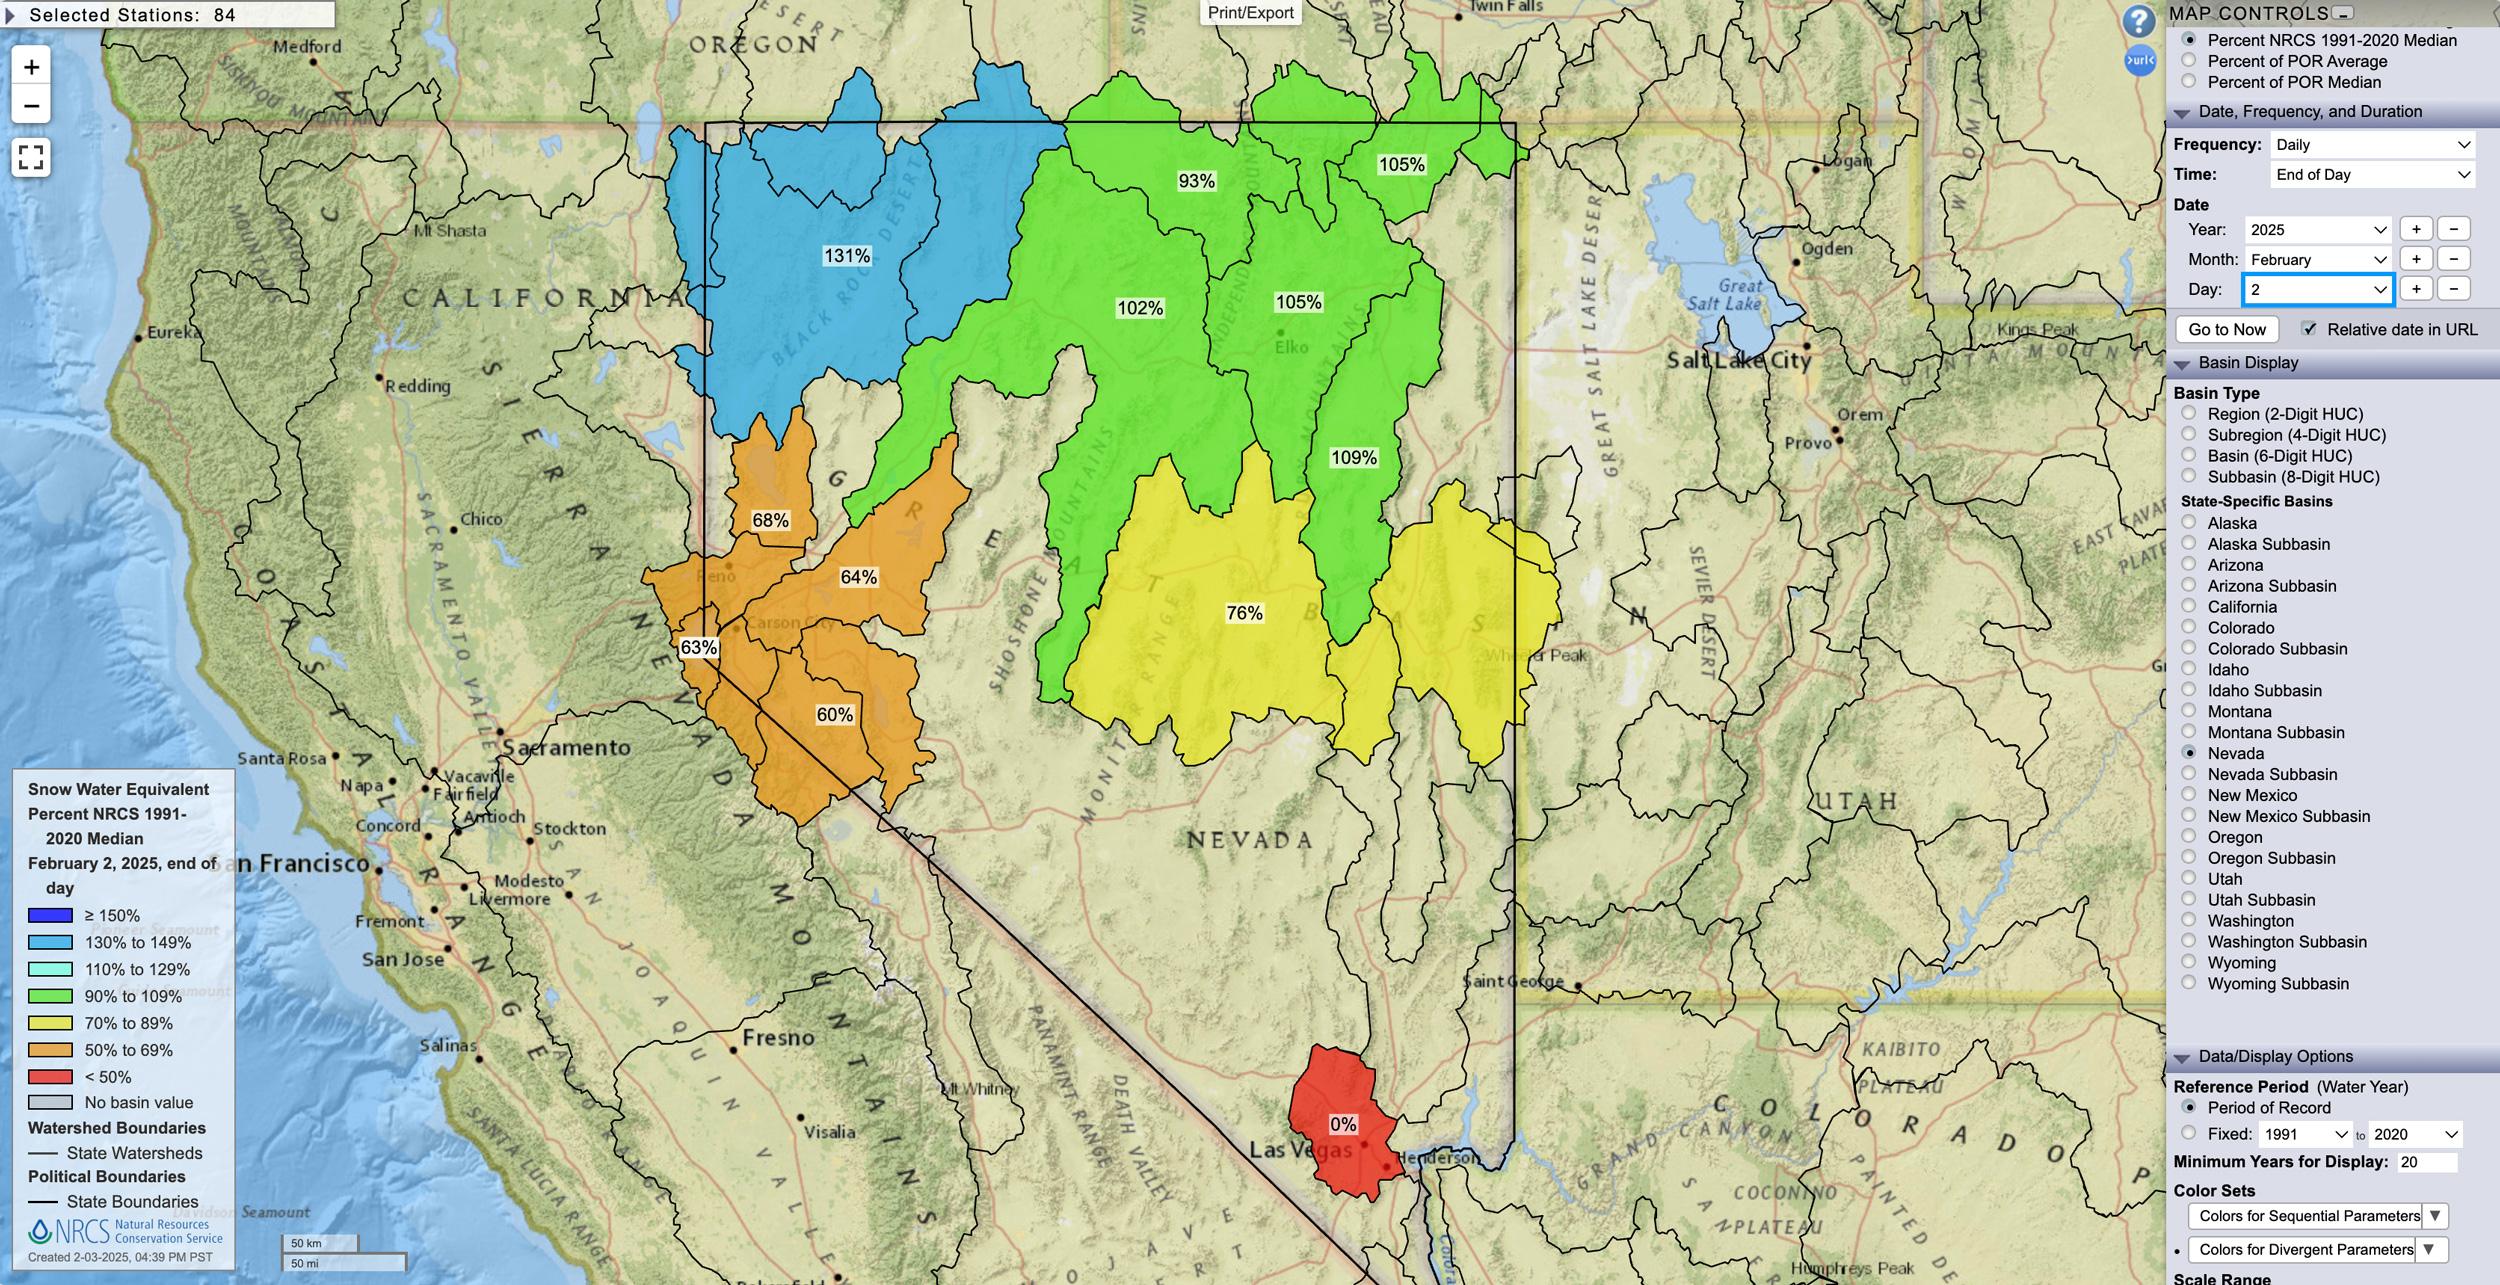
Nevada February 2, 2025 snow water equivalent percent map.
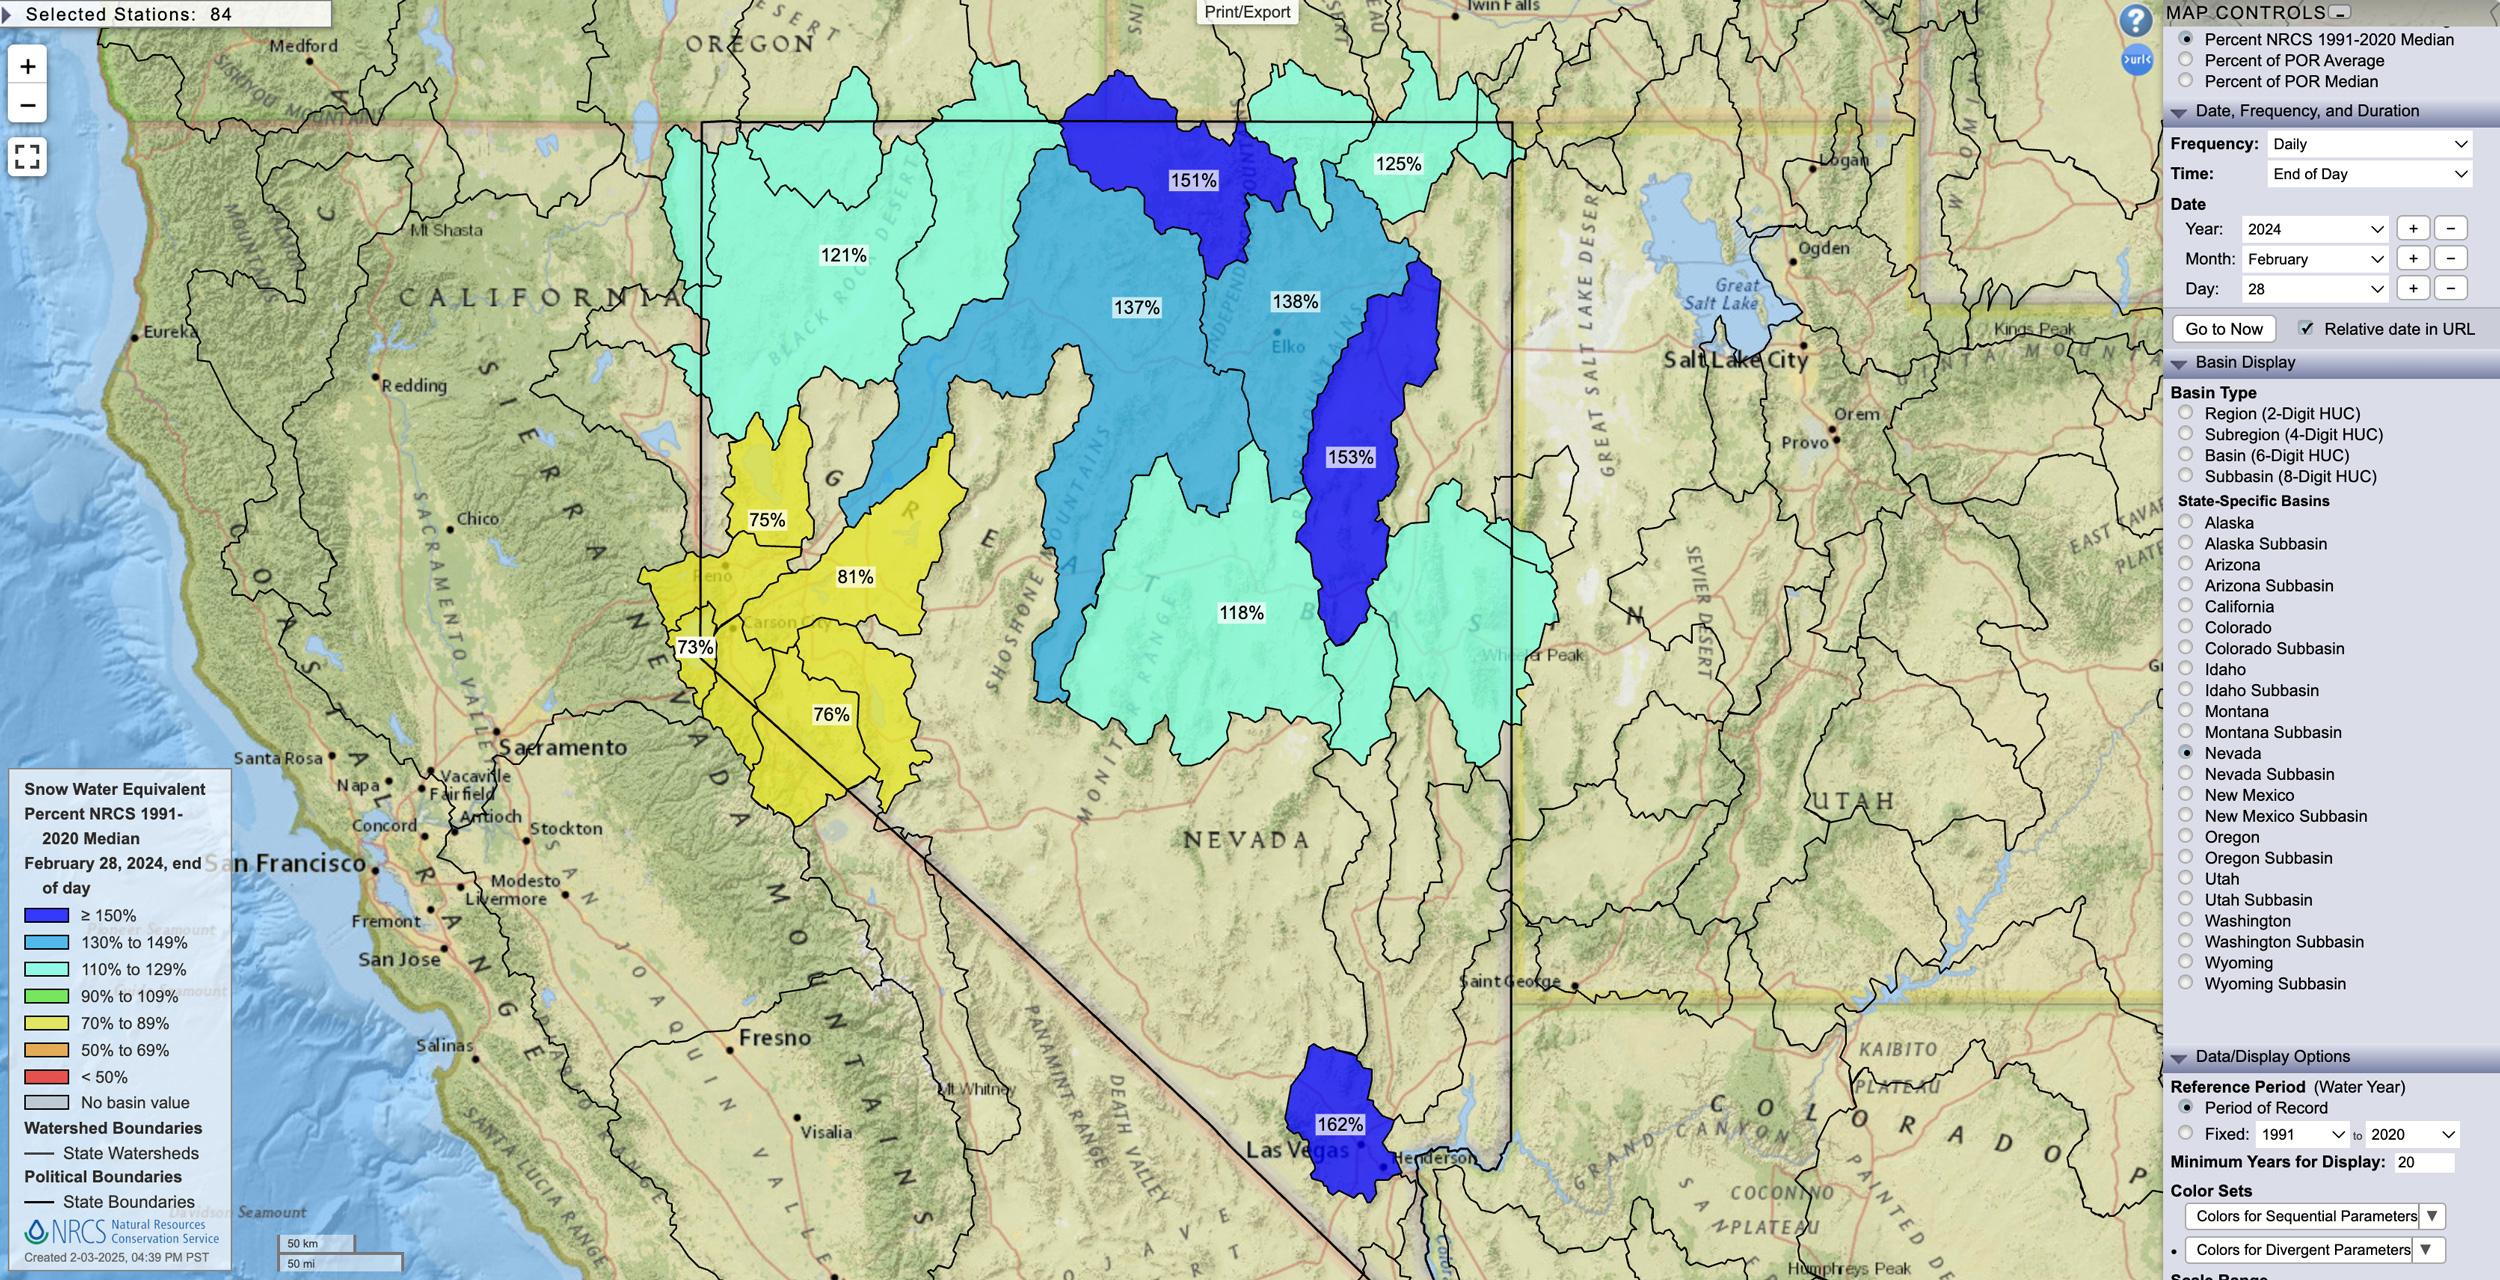
Nevada February 28, 2024 snow water equivalent percent map.
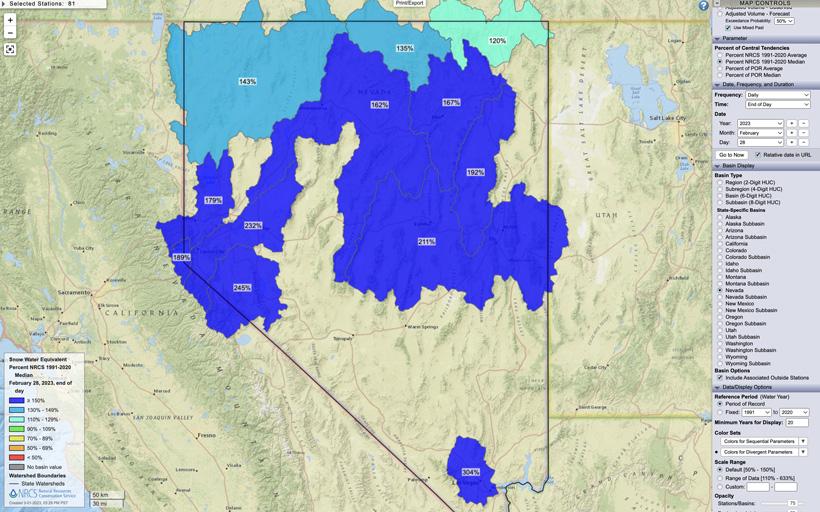
Nevada February 28, 2023 snow water equivalent percent map.
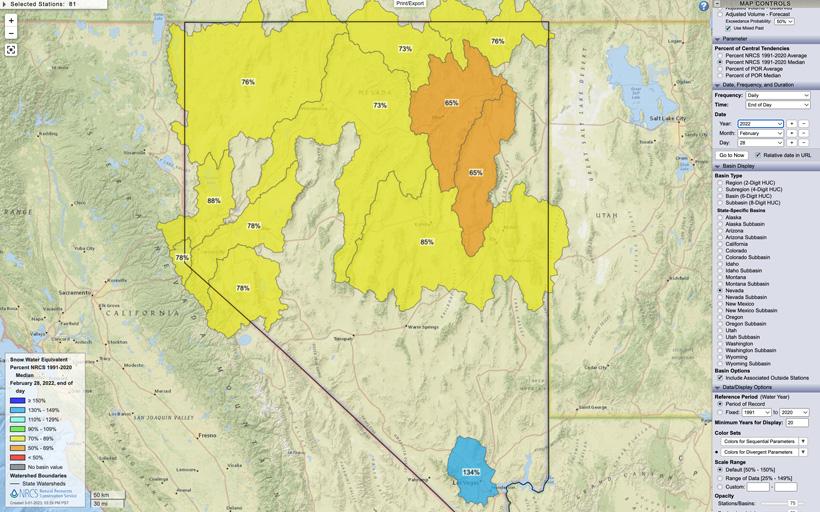
Nevada February 28, 2022 snow water equivalent percent map.
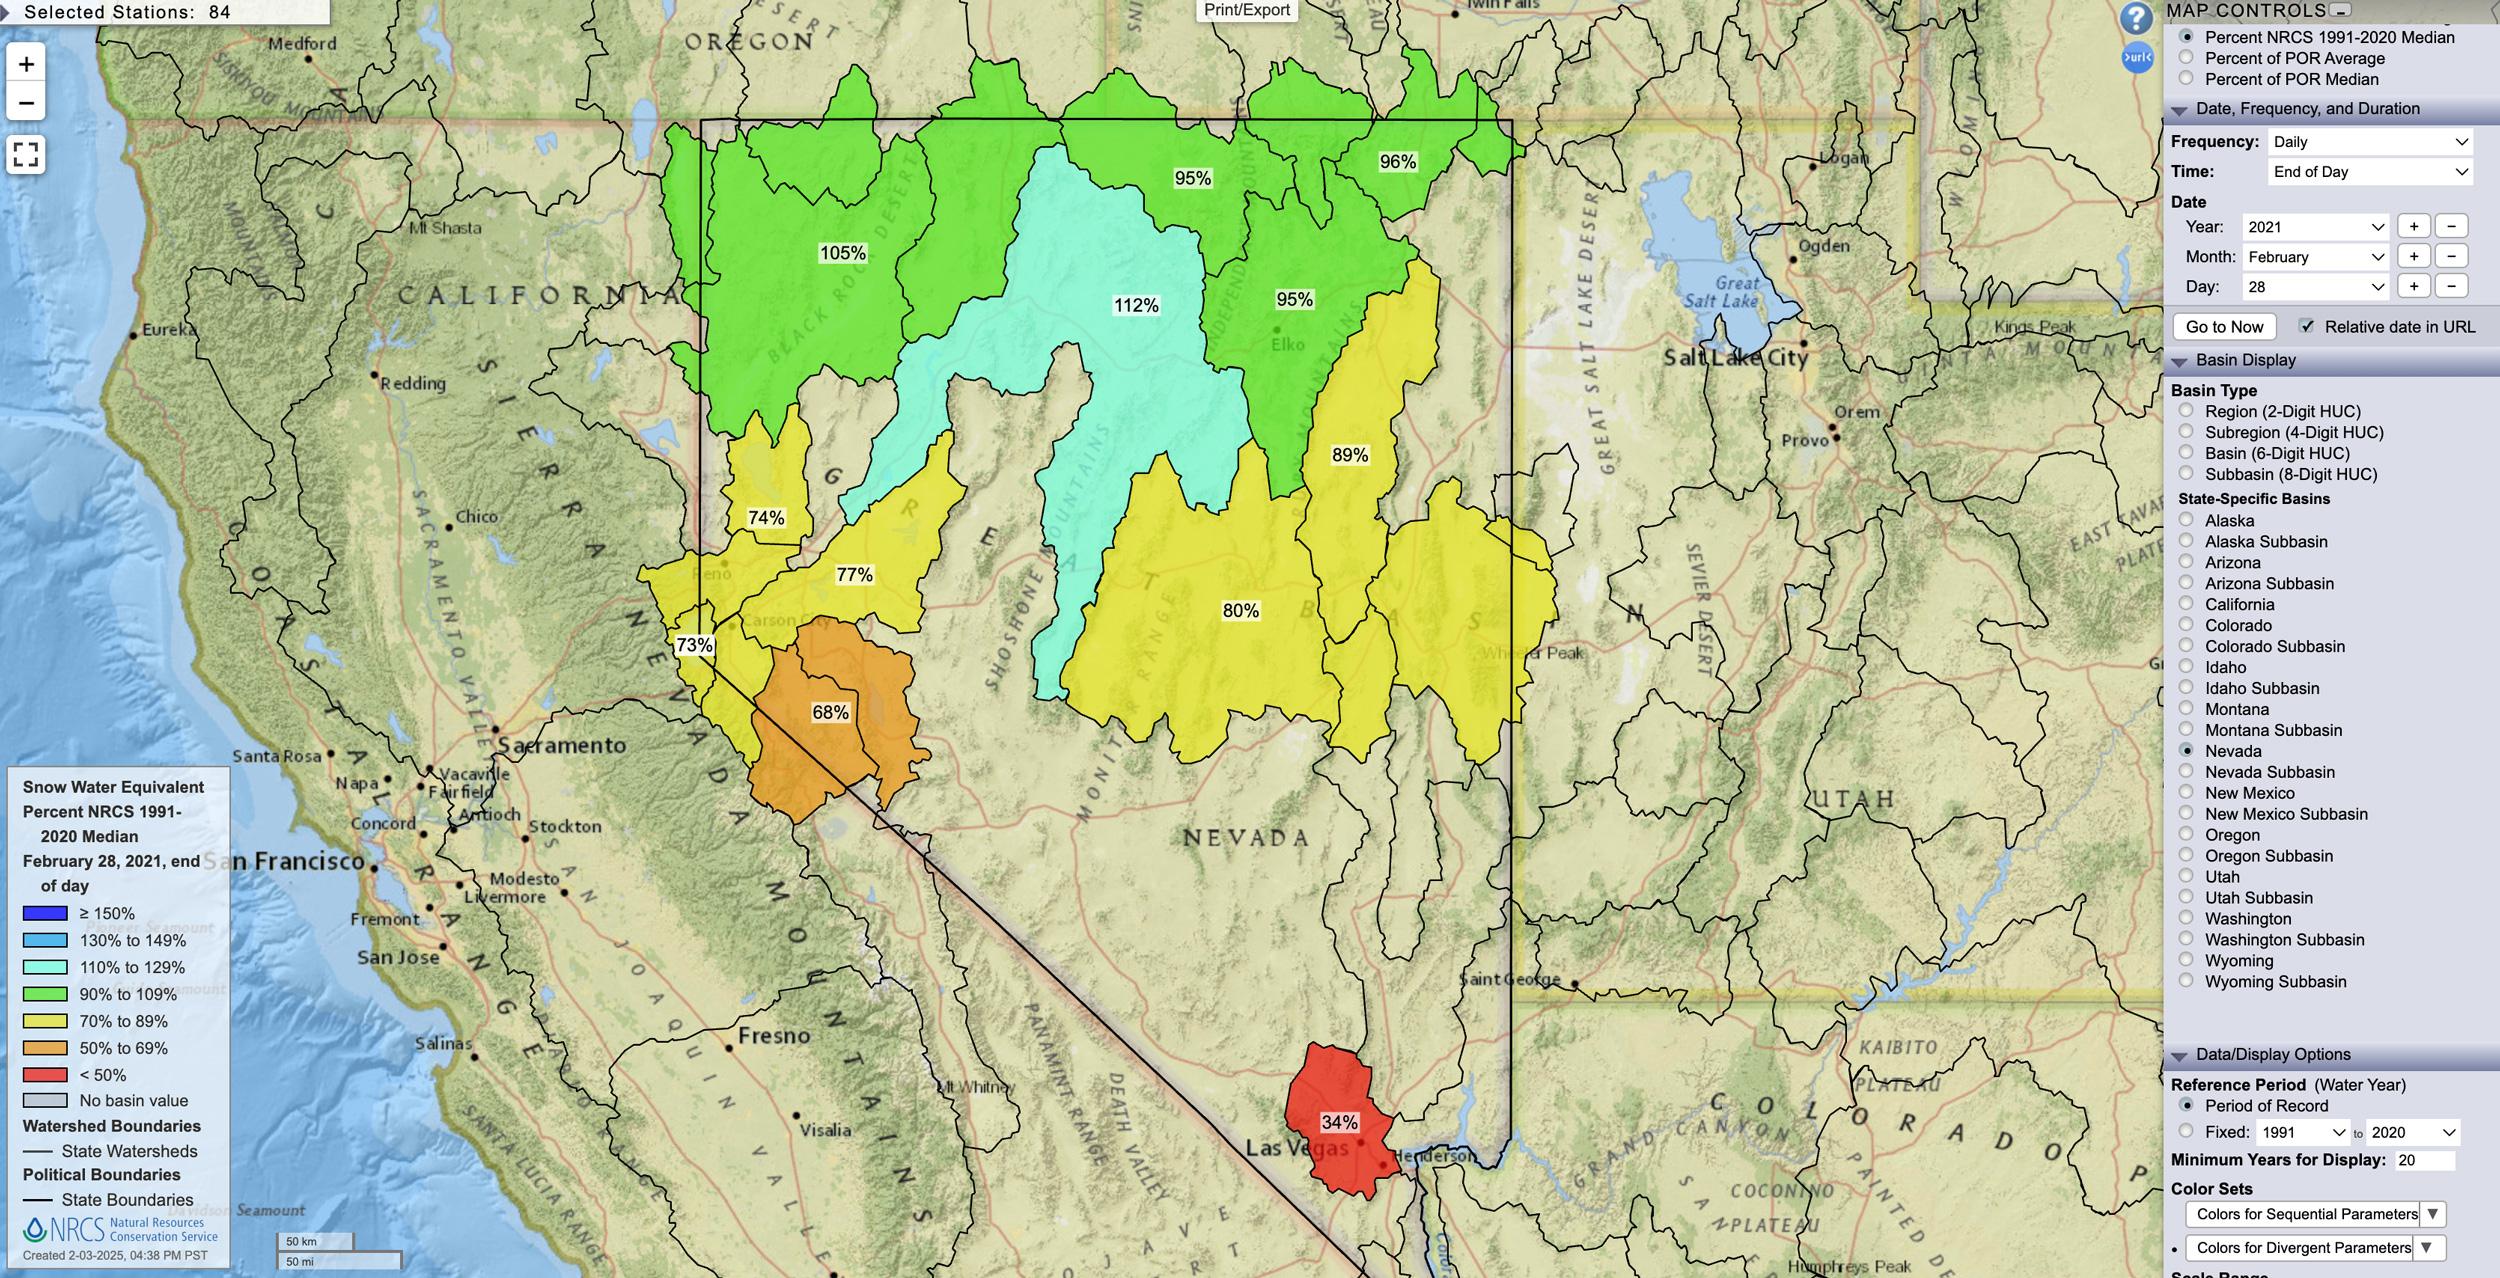
Nevada February 28, 2021 snow water equivalent percent map.
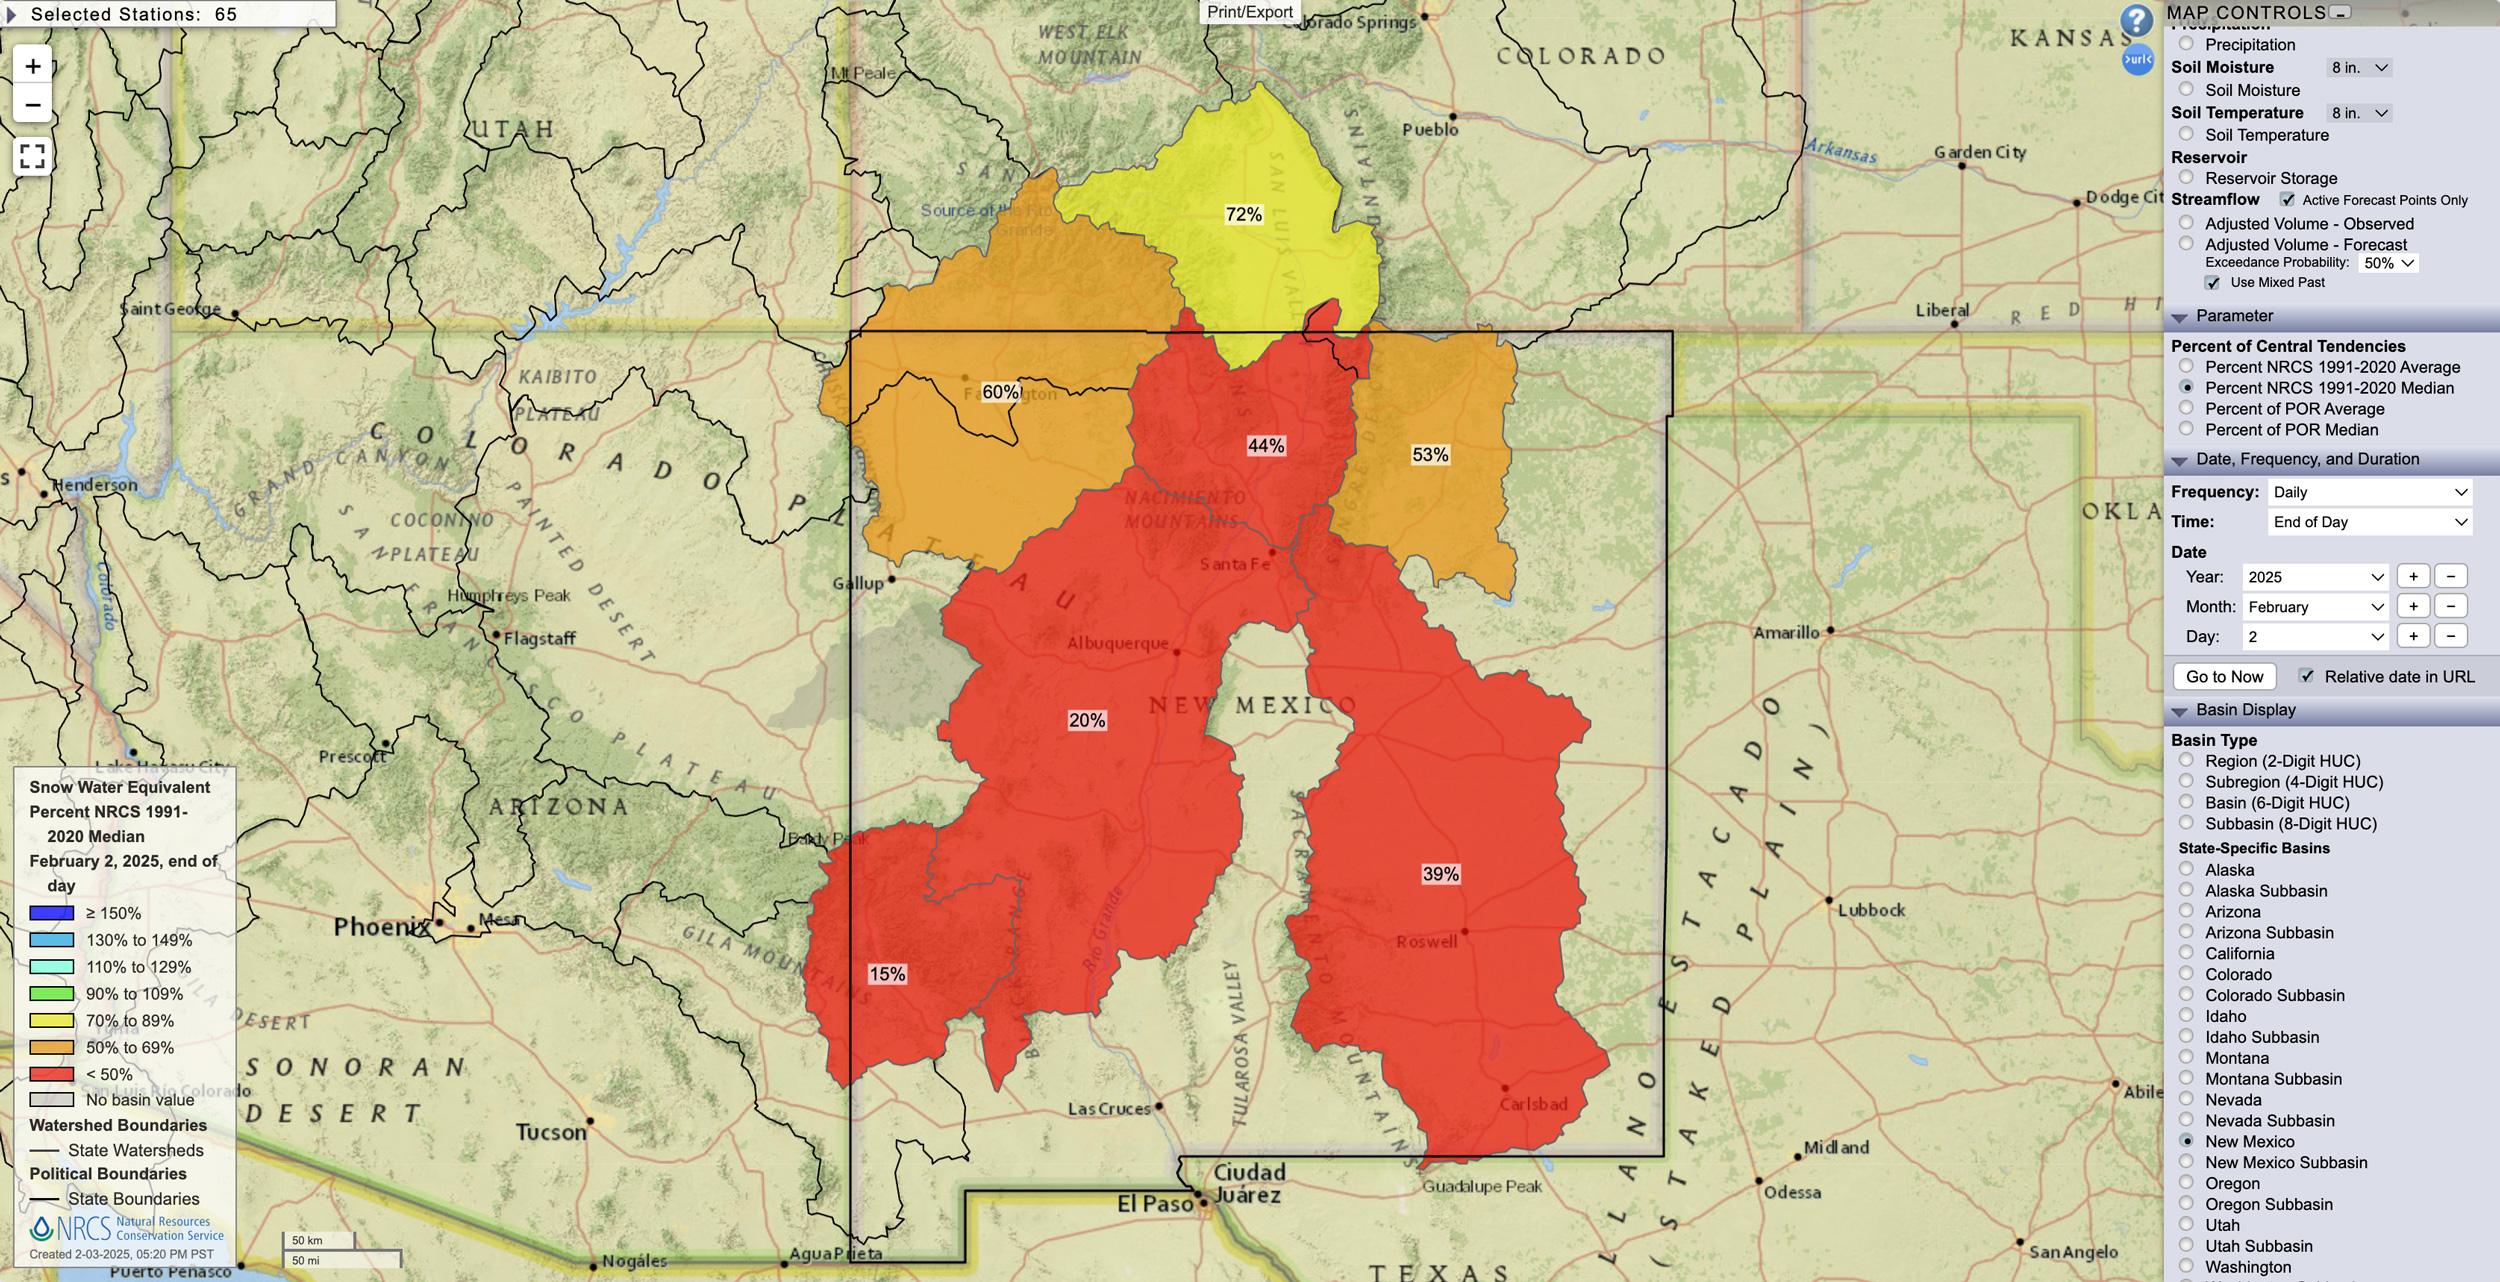
New Mexico February 2, 2025 snow water equivalent percent map.
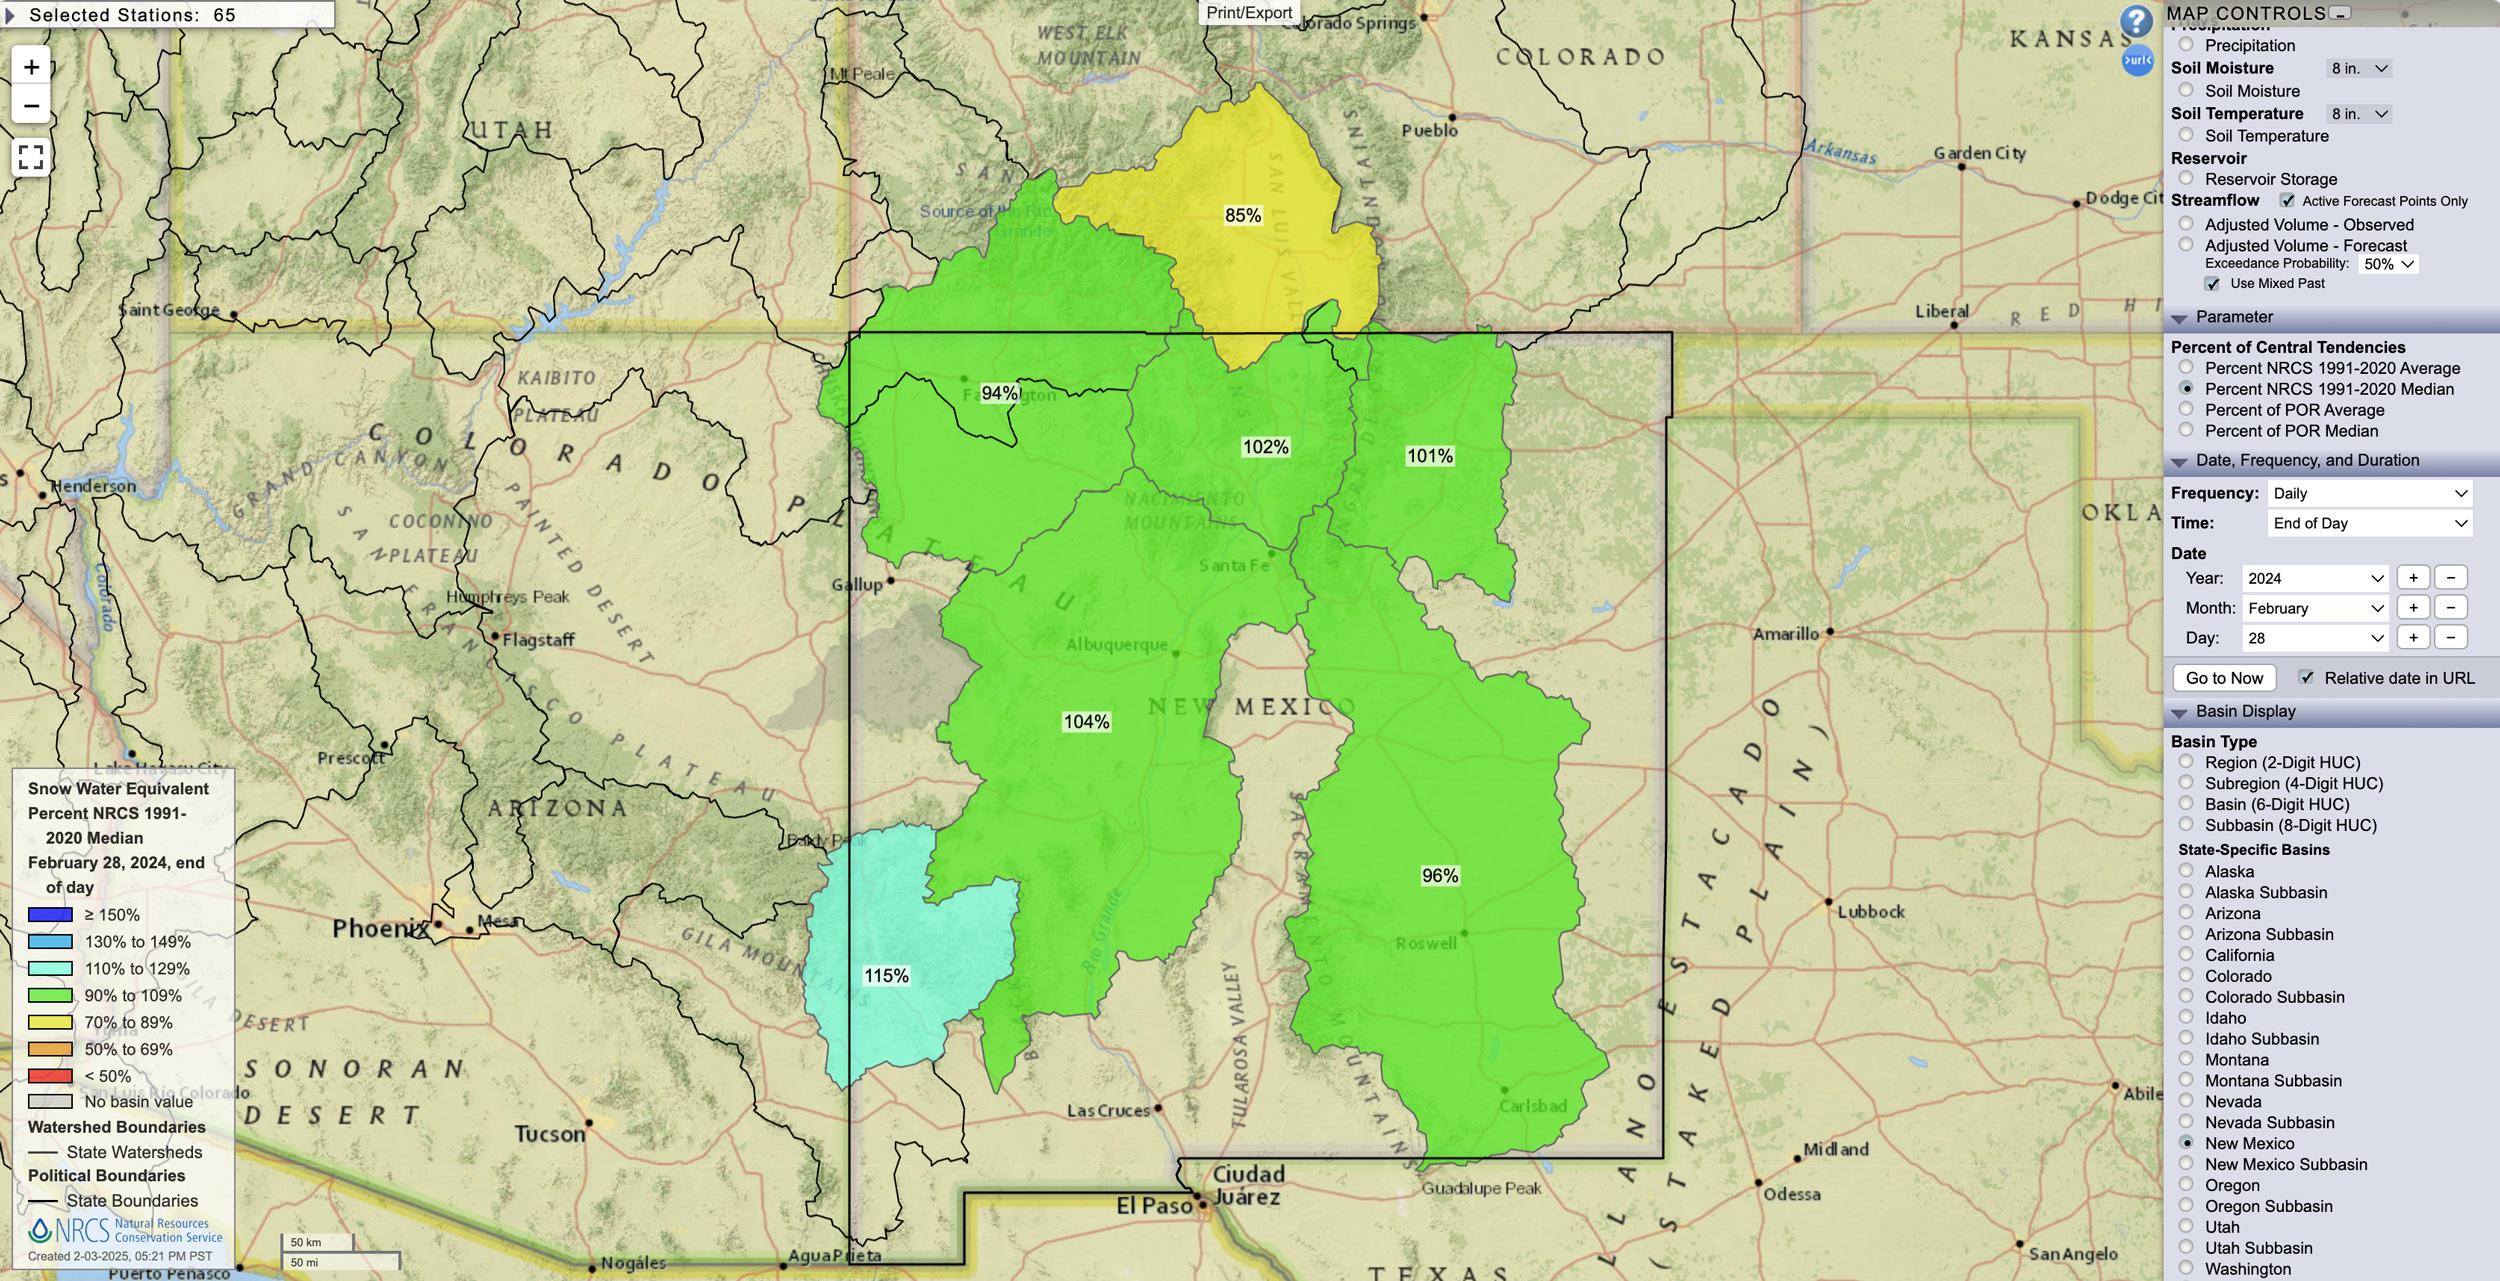
New Mexico February 28, 2024 snow water equivalent percent map.
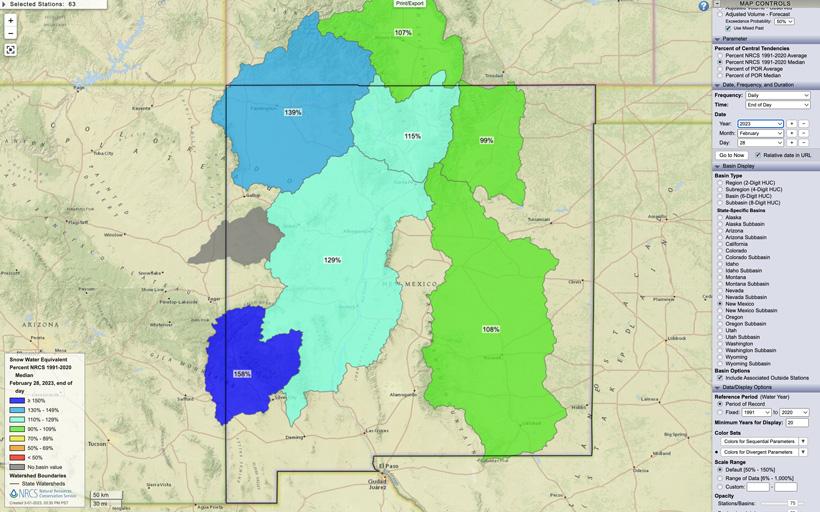
New Mexico February 28, 2023 snow water equivalent percent map.
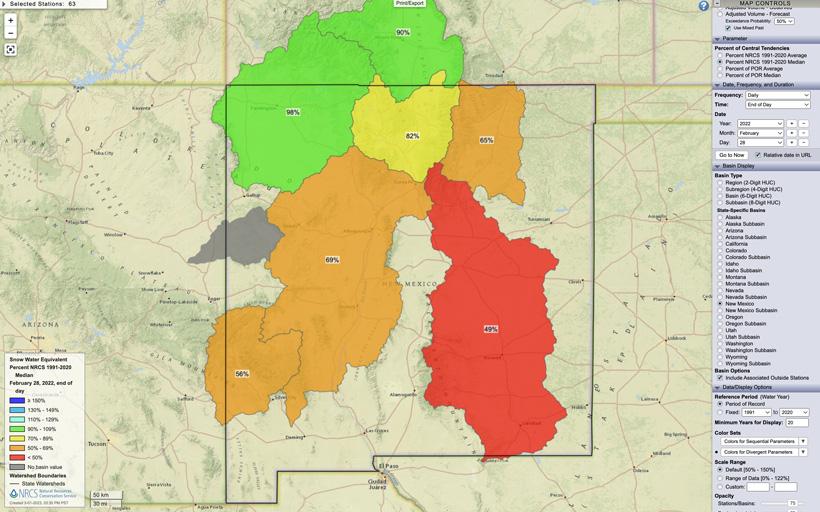
New Mexico February 28, 2022 snow water equivalent percent map
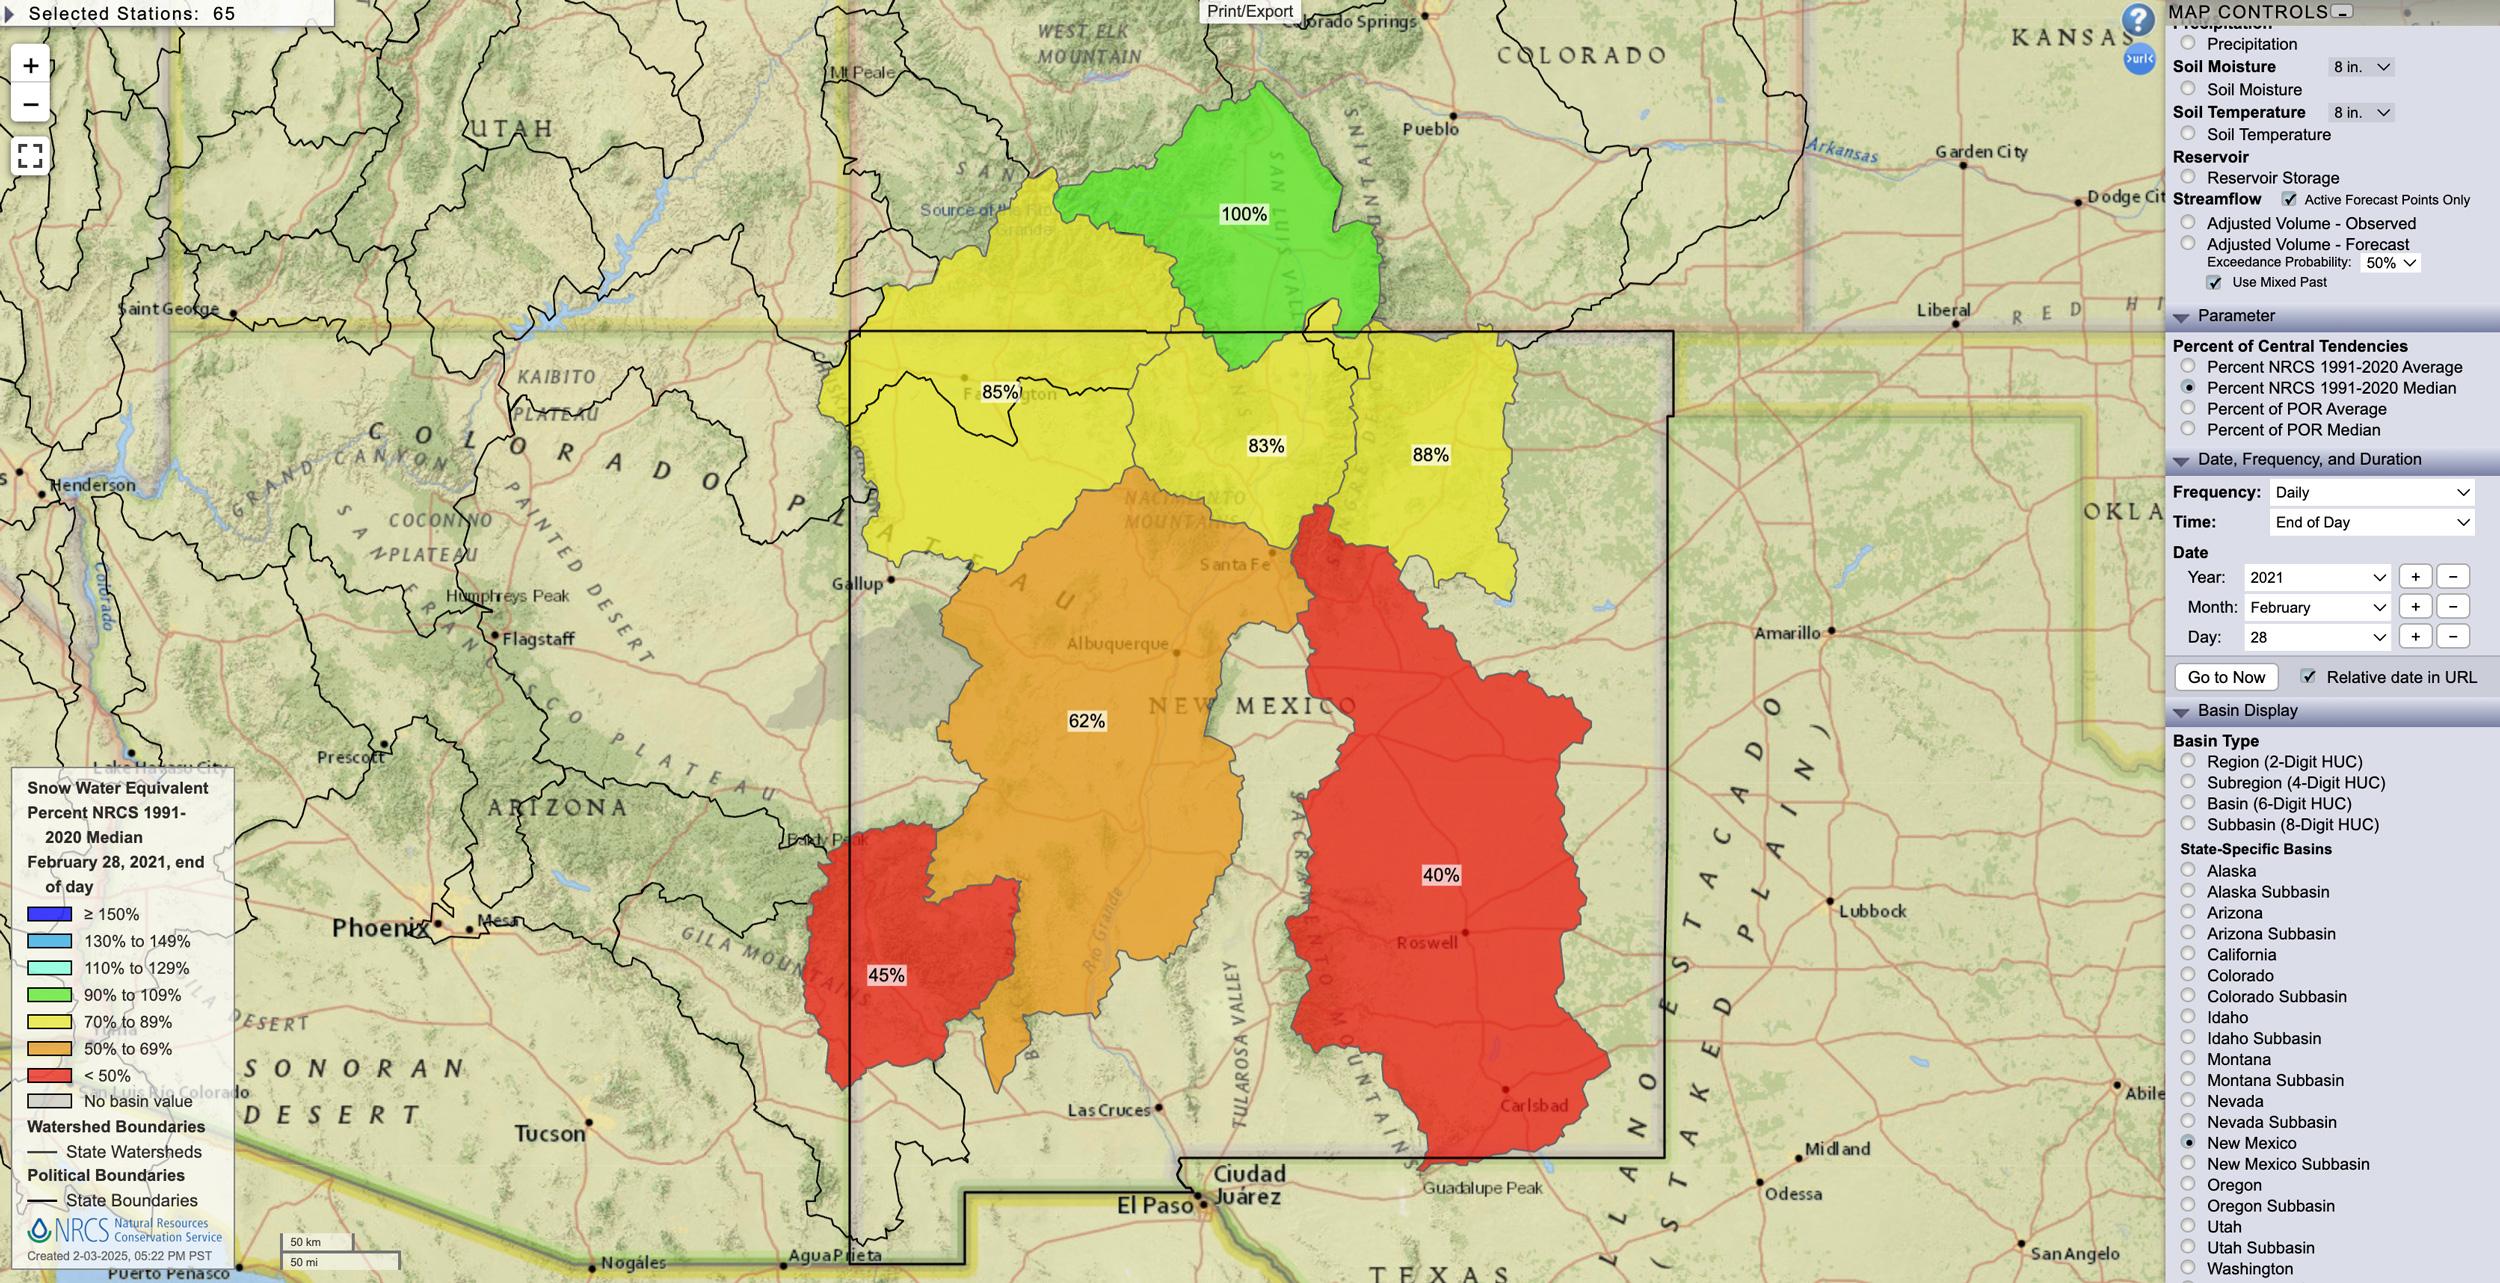
New Mexico February 28, 2021 snow water equivalent percent map.
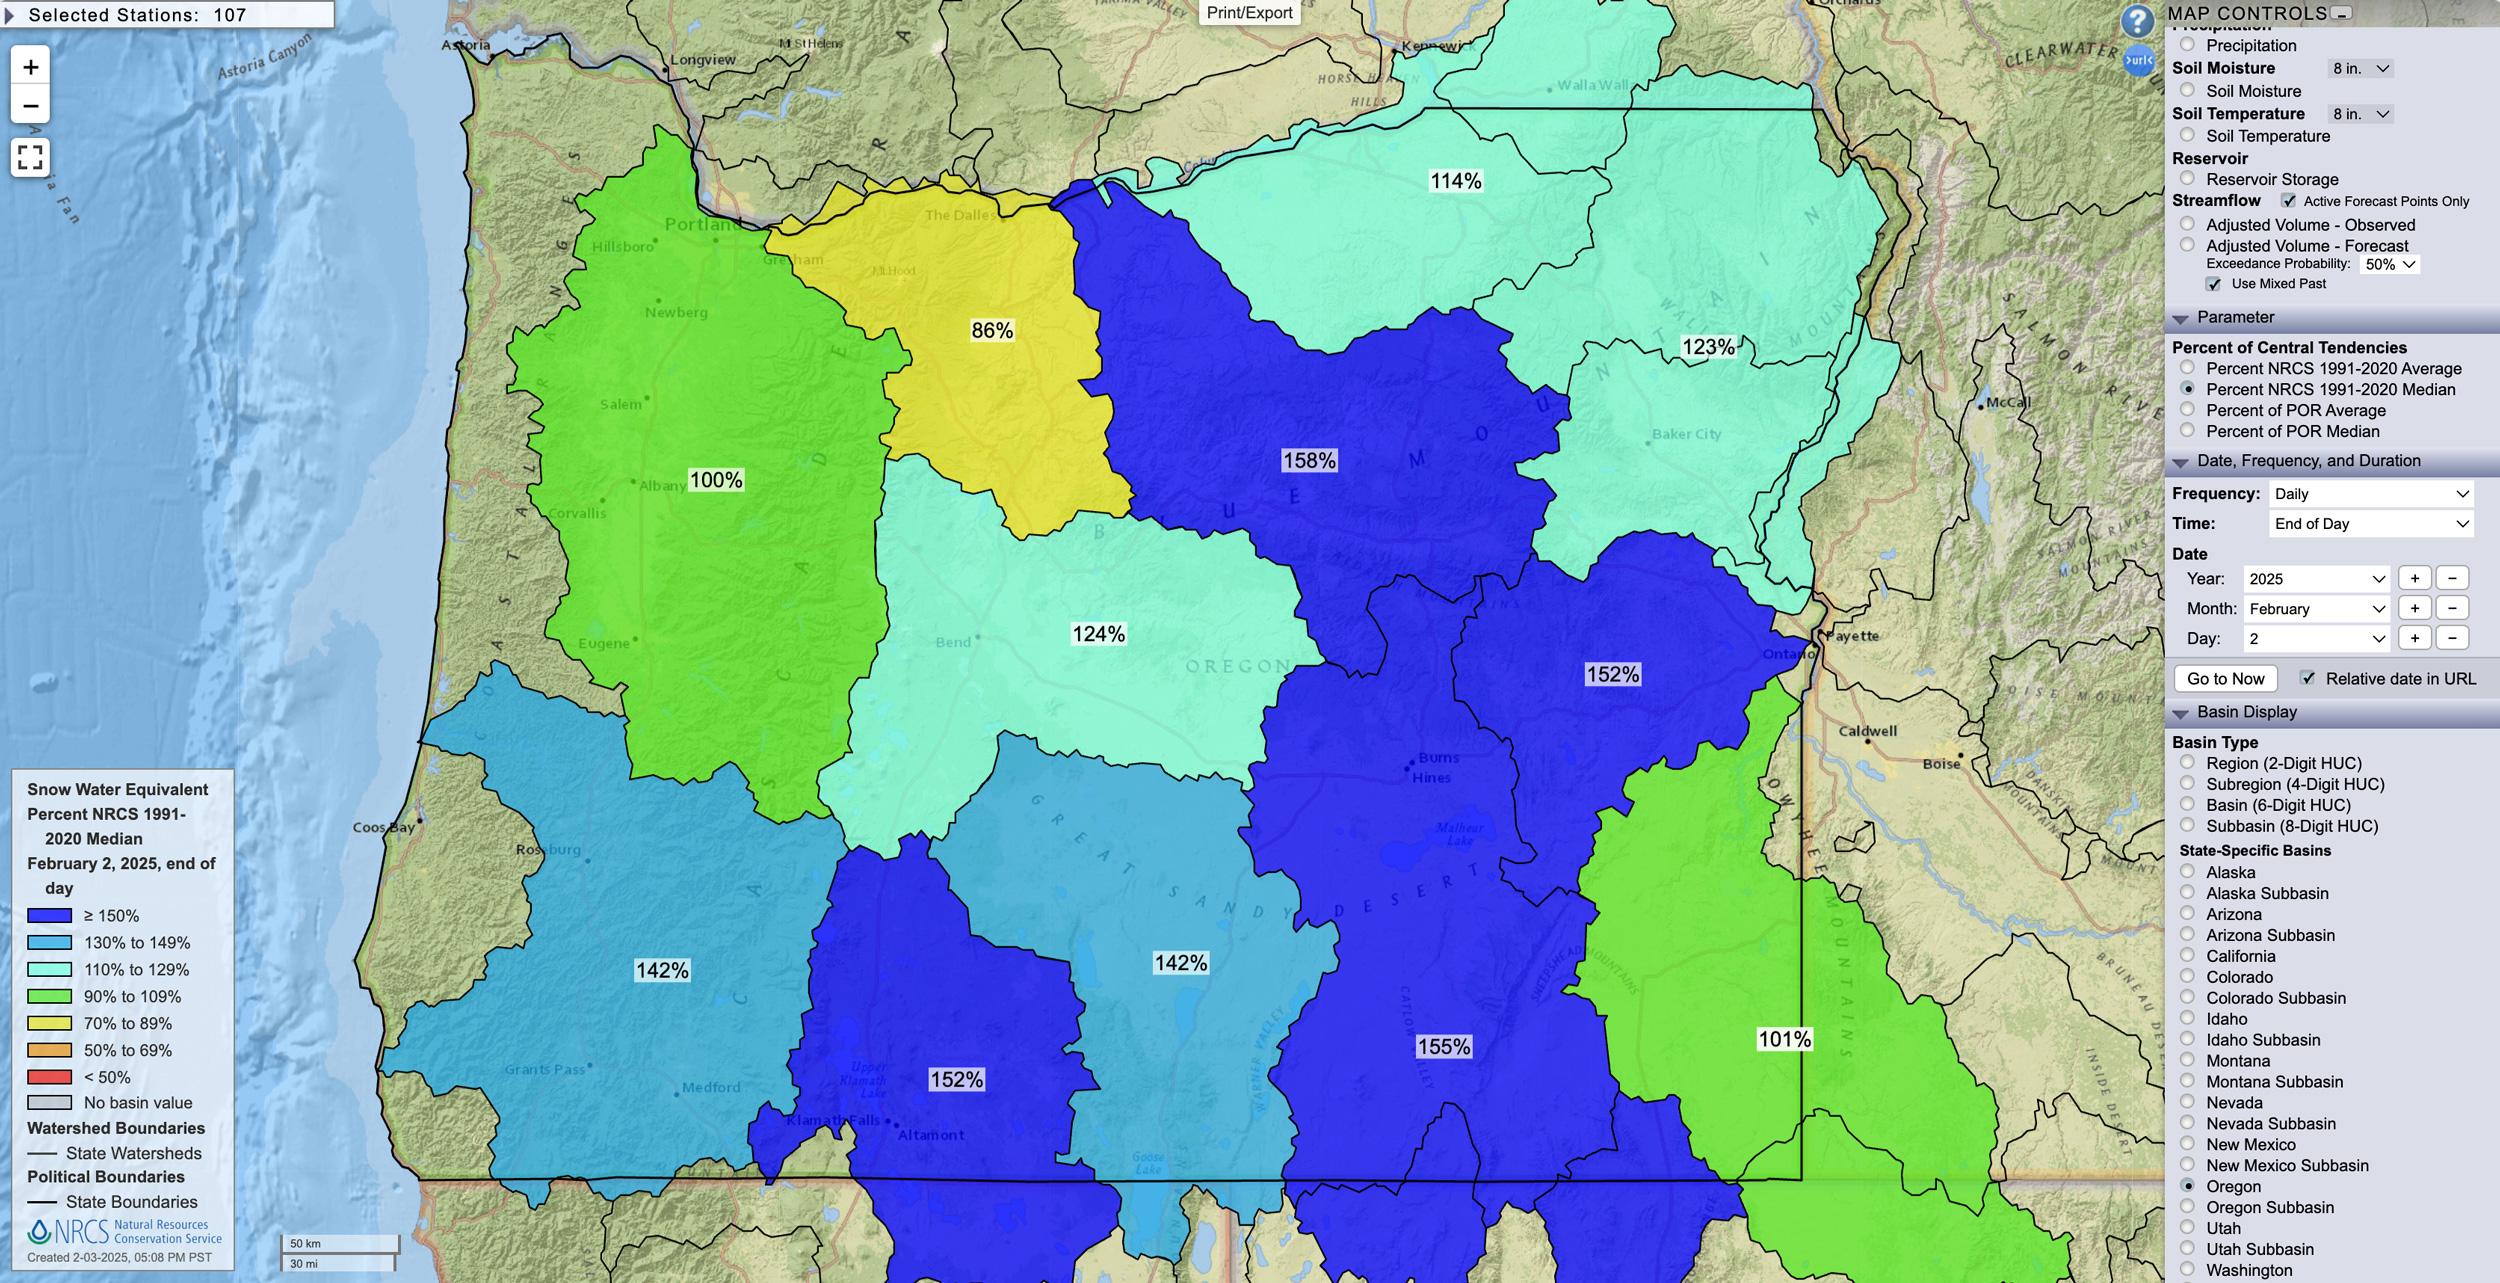
Oregon February 2, 2025 snow water equivalent percent map.
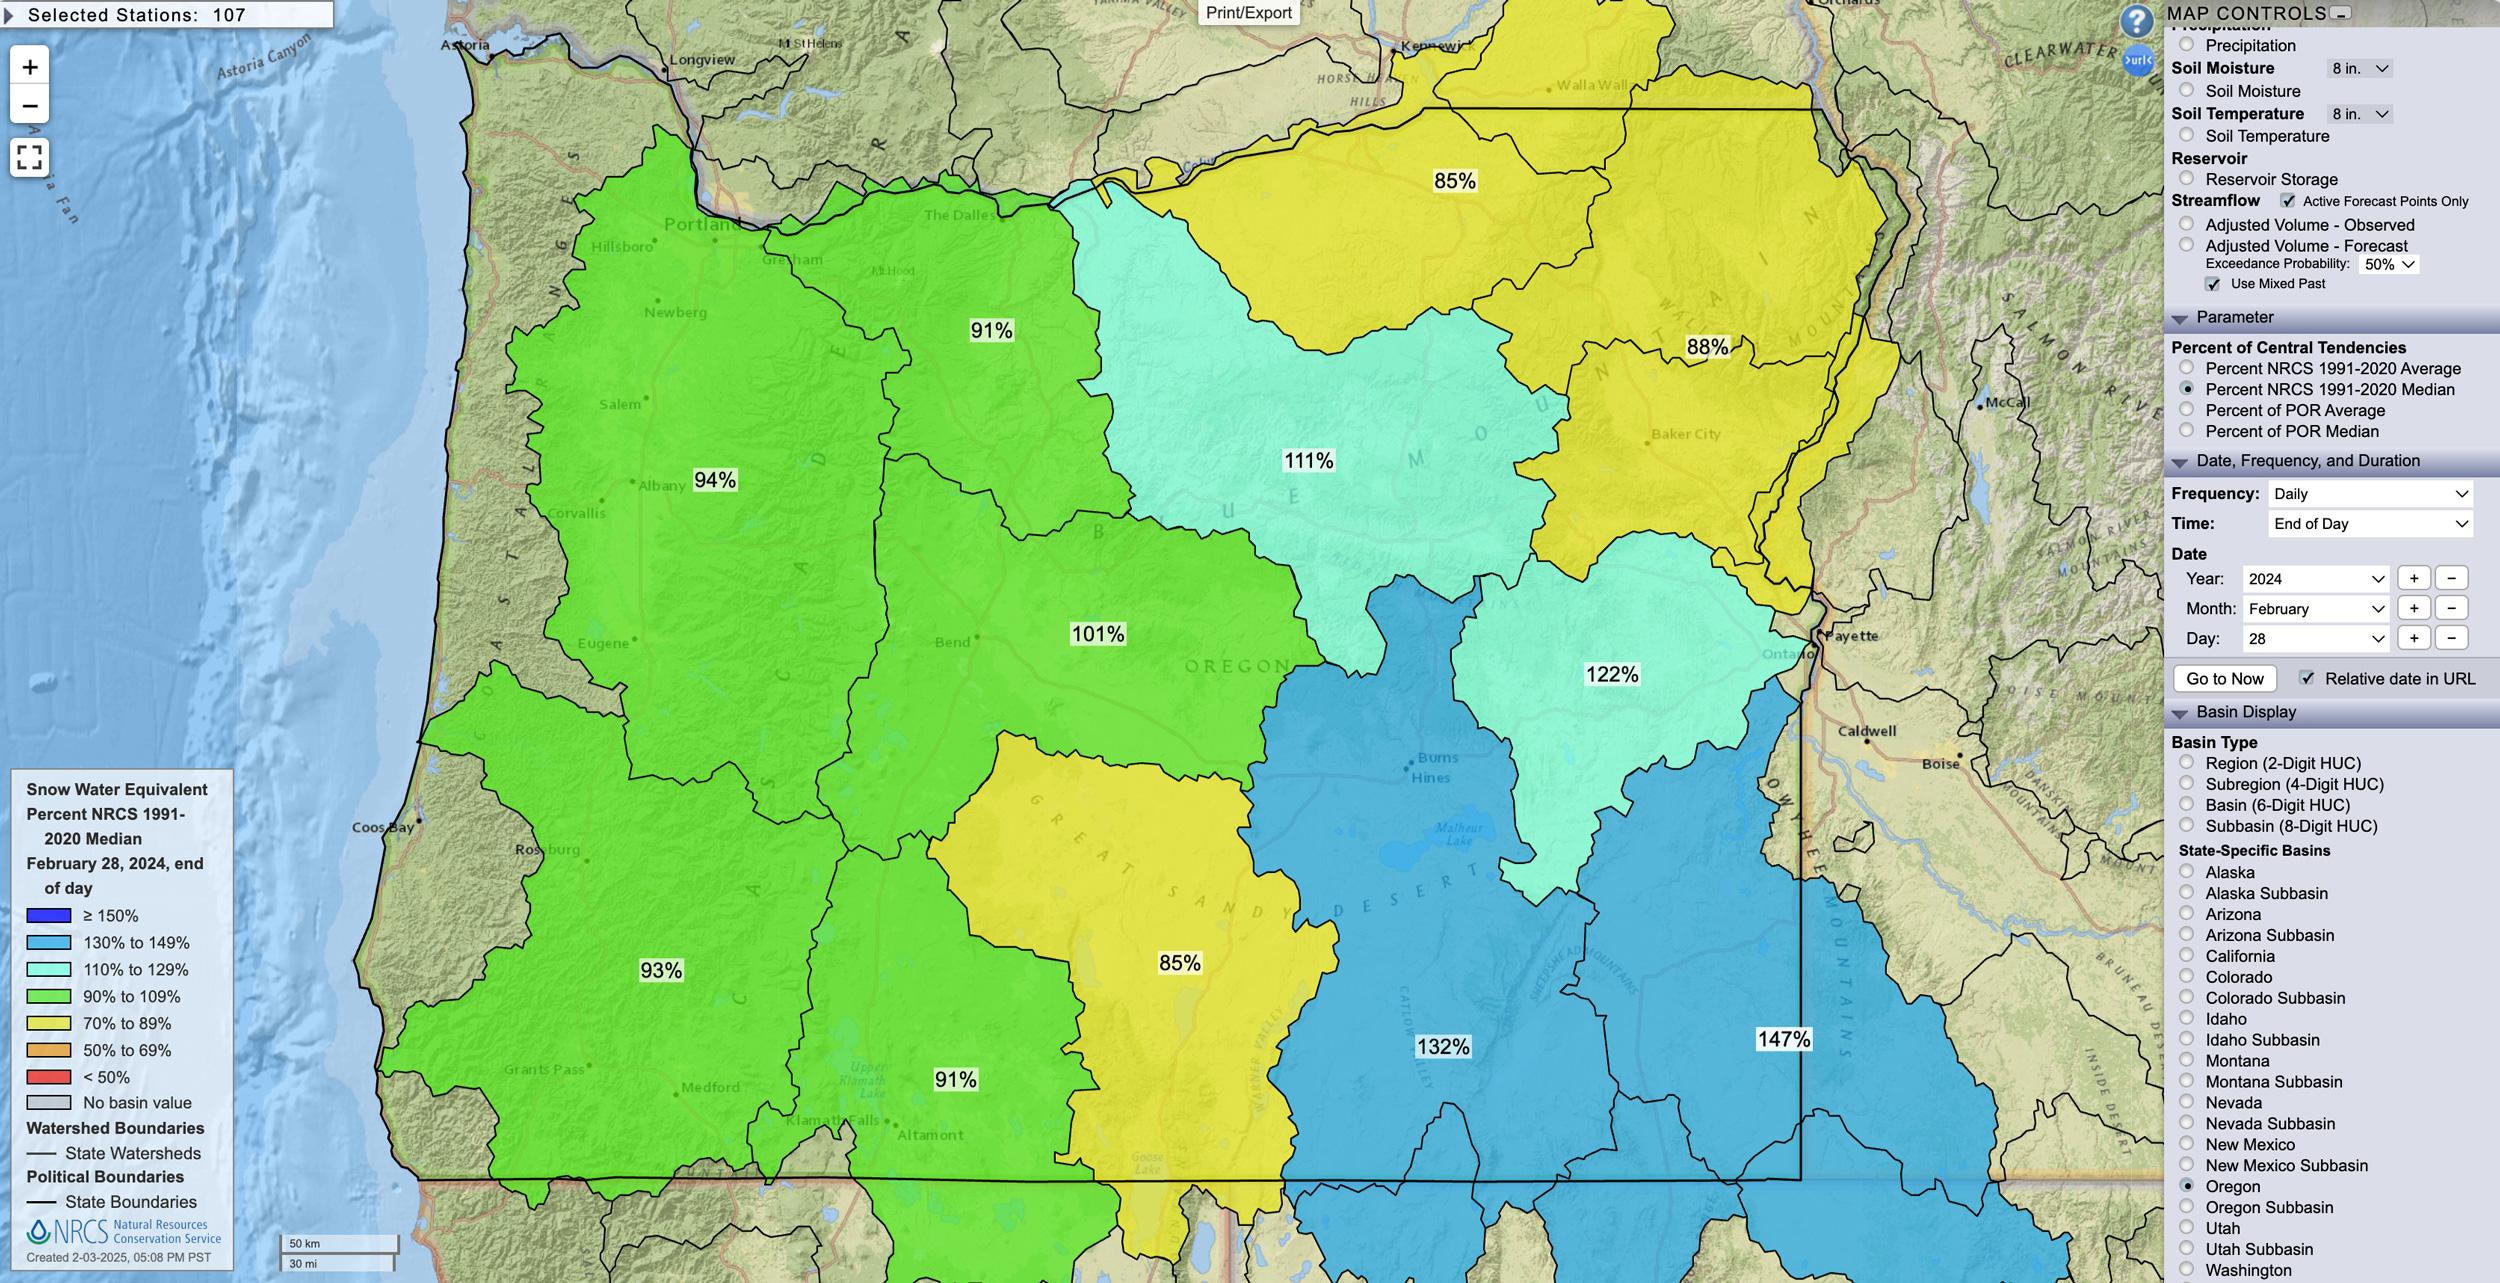
Oregon February 28, 2024 snow water equivalent percent map.
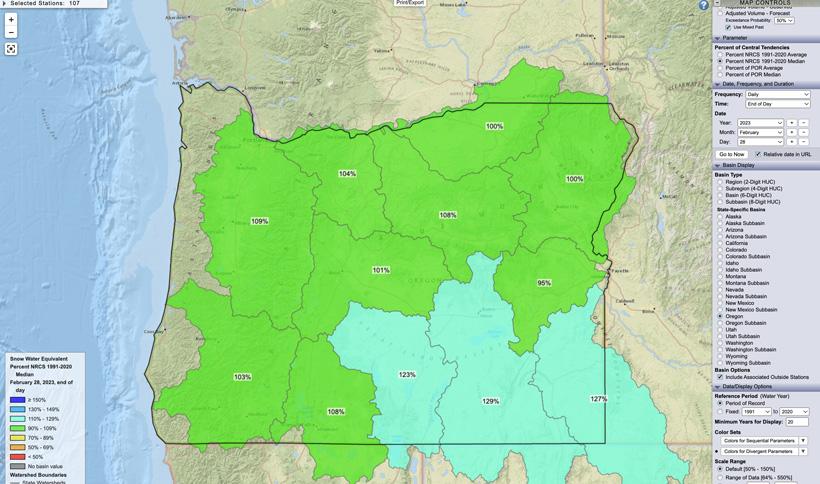
Oregon February 28, 2023 snow water equivalent percent map
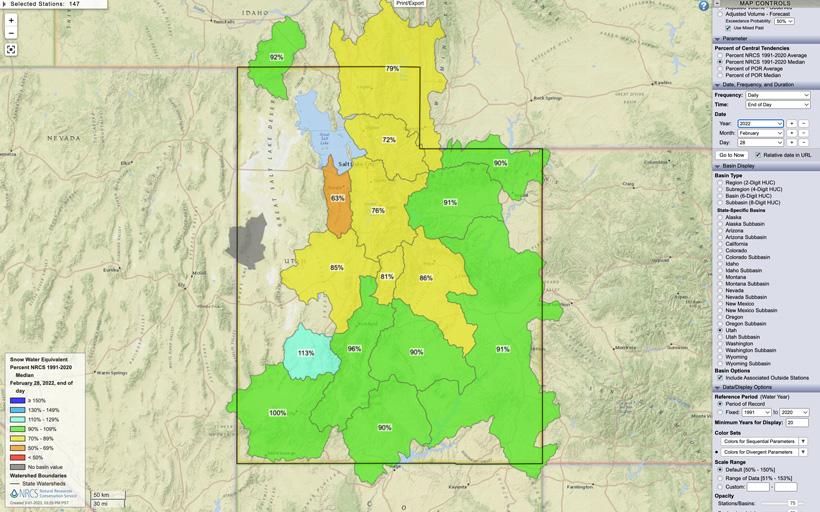
Oregon February 28, 2022 snow water equivalent percent map
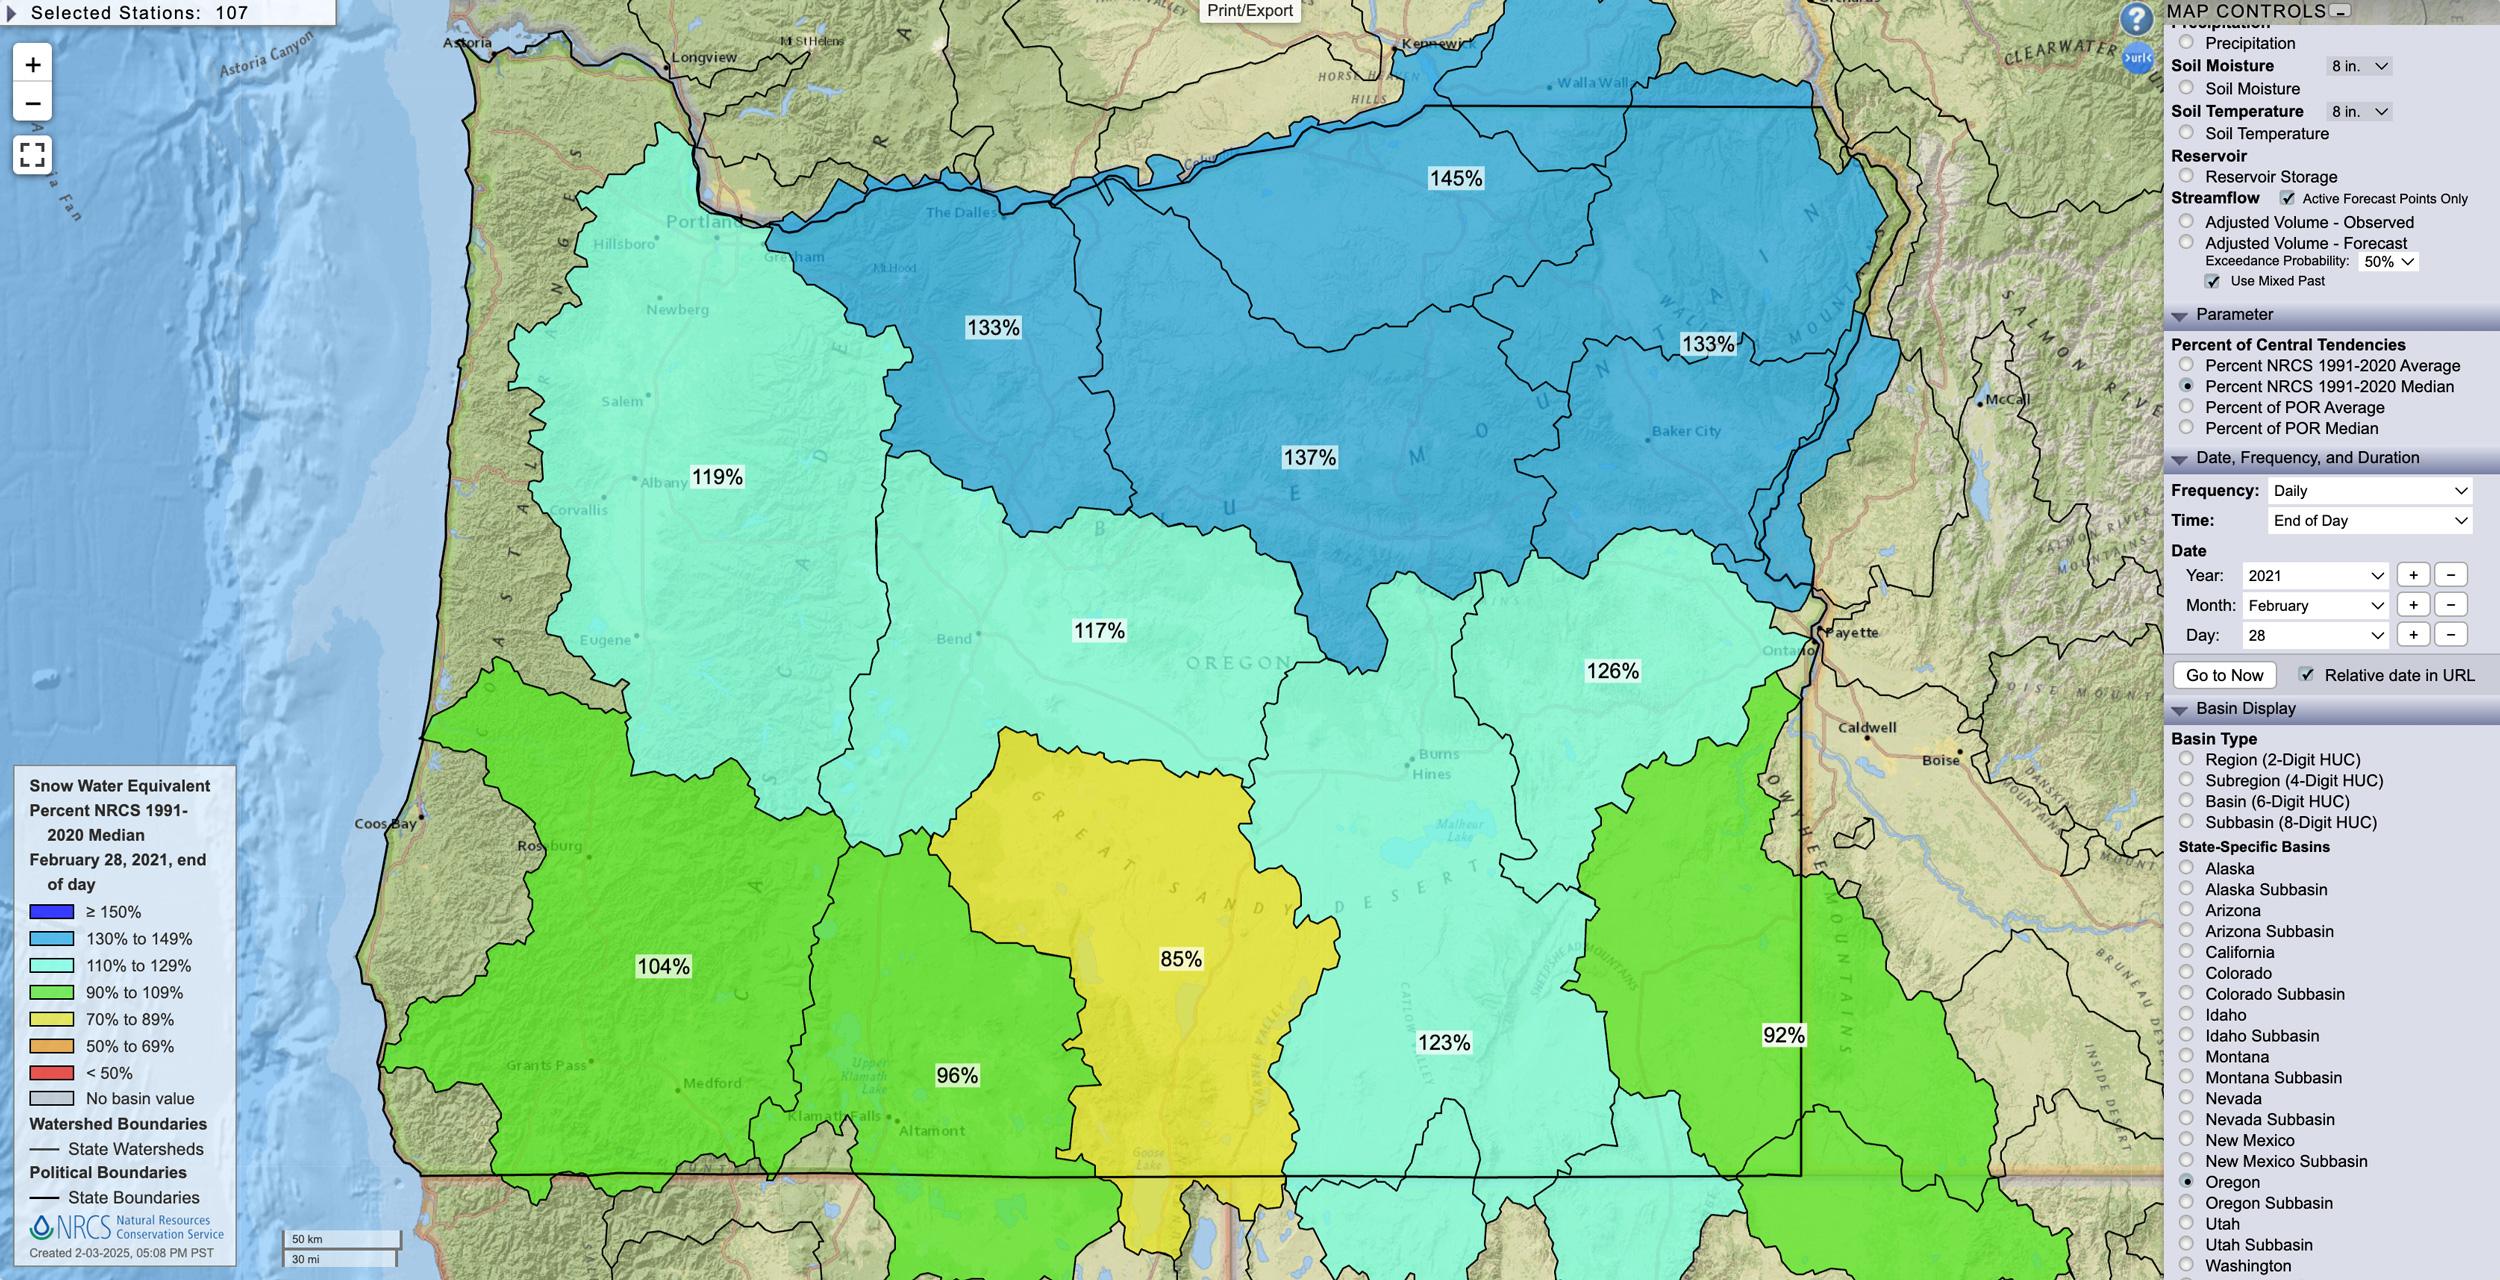
Oregon February 28, 2021 snow water equivalent percent map.
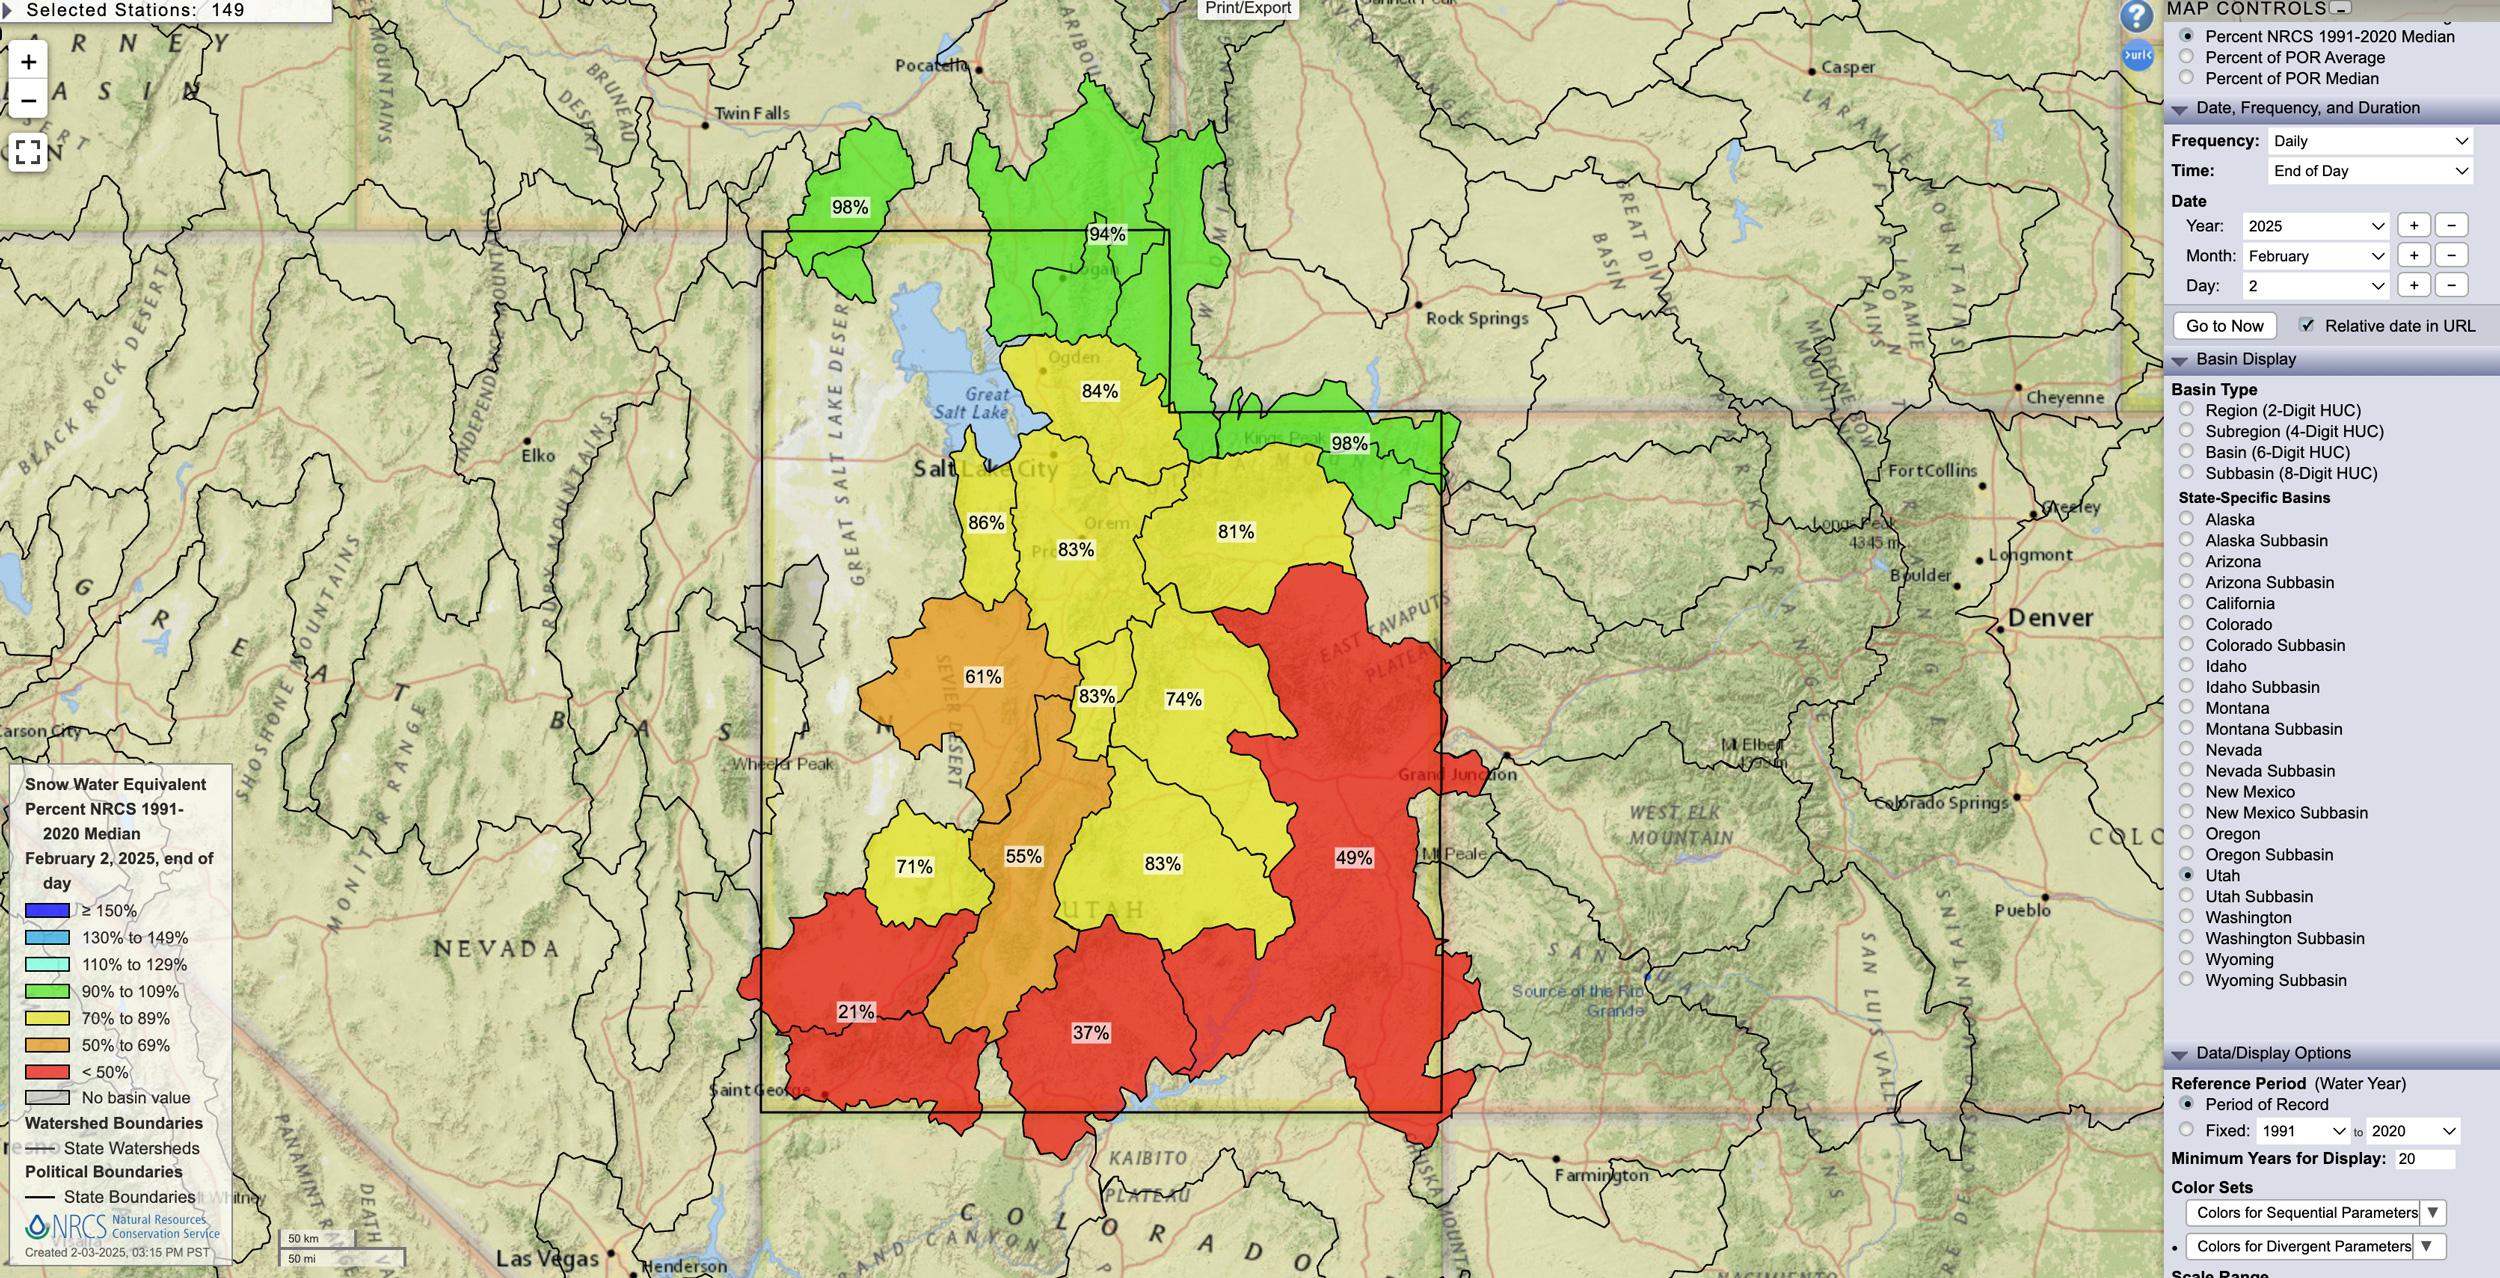
Utah February 2, 2025 snow water equivalent percent map.
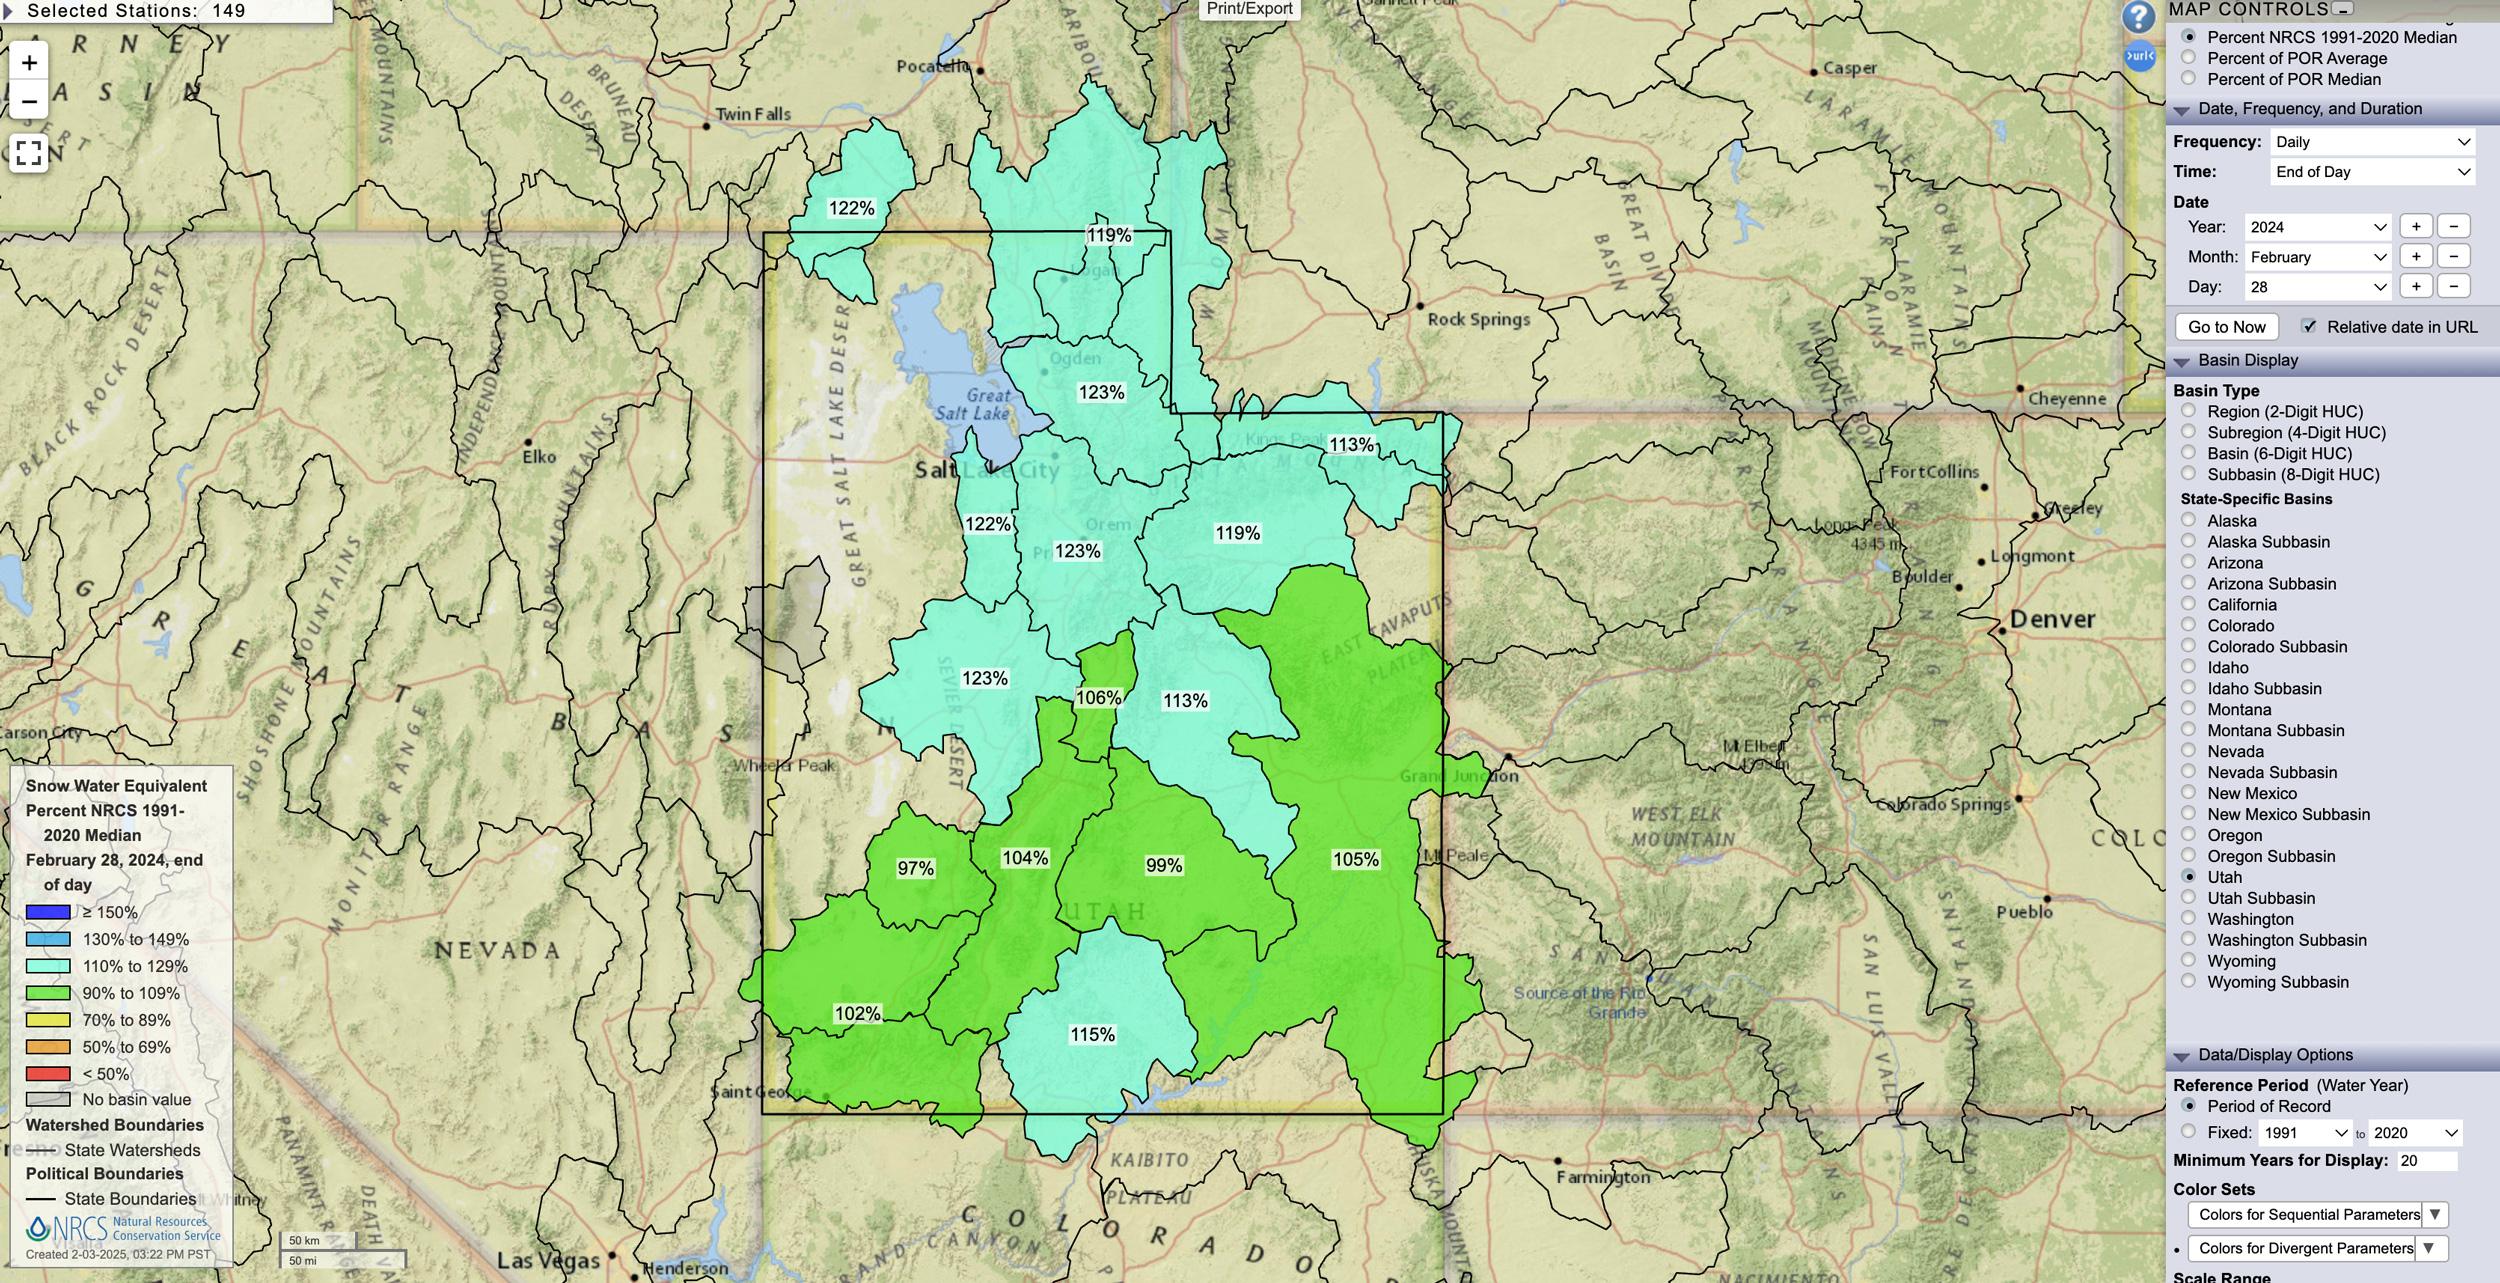
Utah February 28, 2024 snow water equivalent percent map.
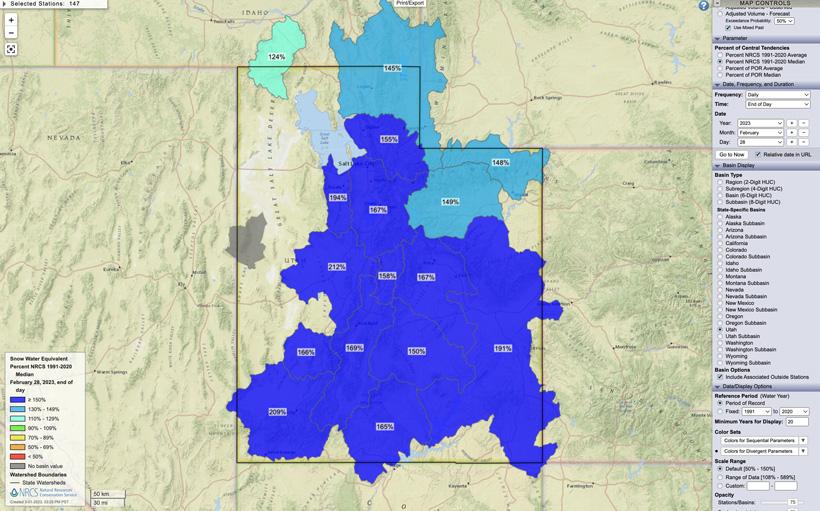
Utah February 28, 2023 snow water equivalent percent map.
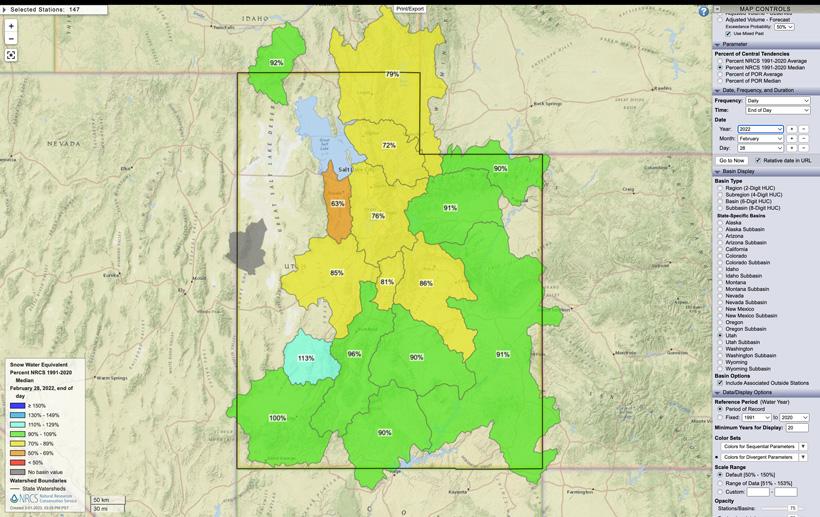
Utah February 28, 2022 snow water equivalent percent map.
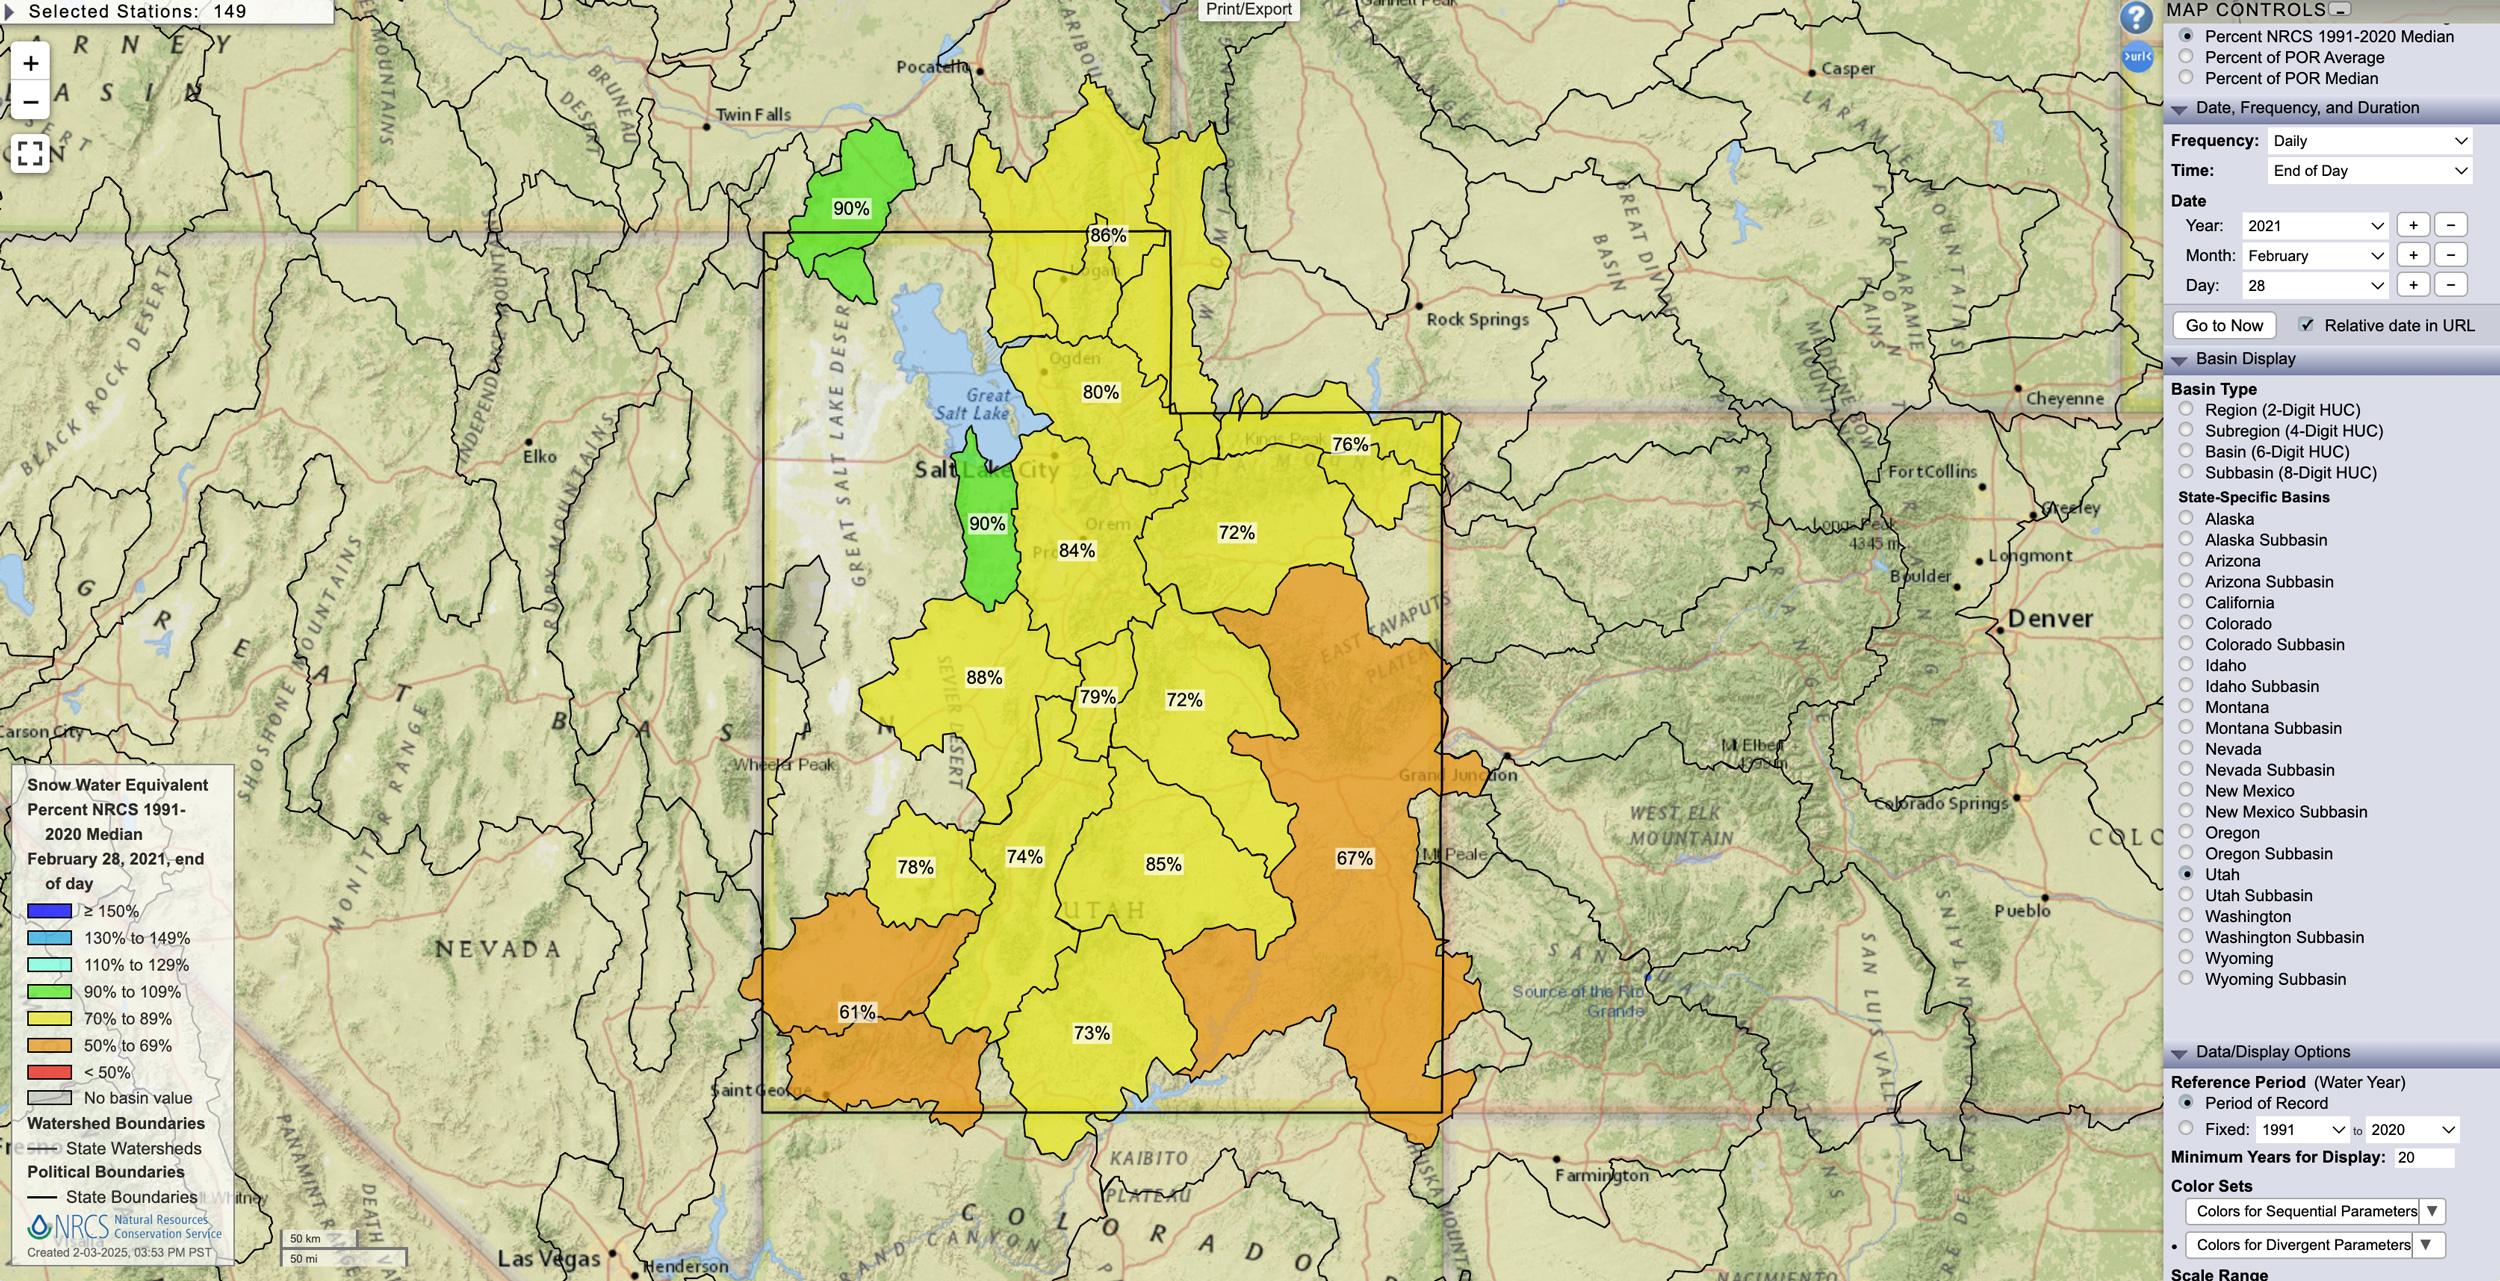
Utah February 28, 2021 snow water equivalent percent map.
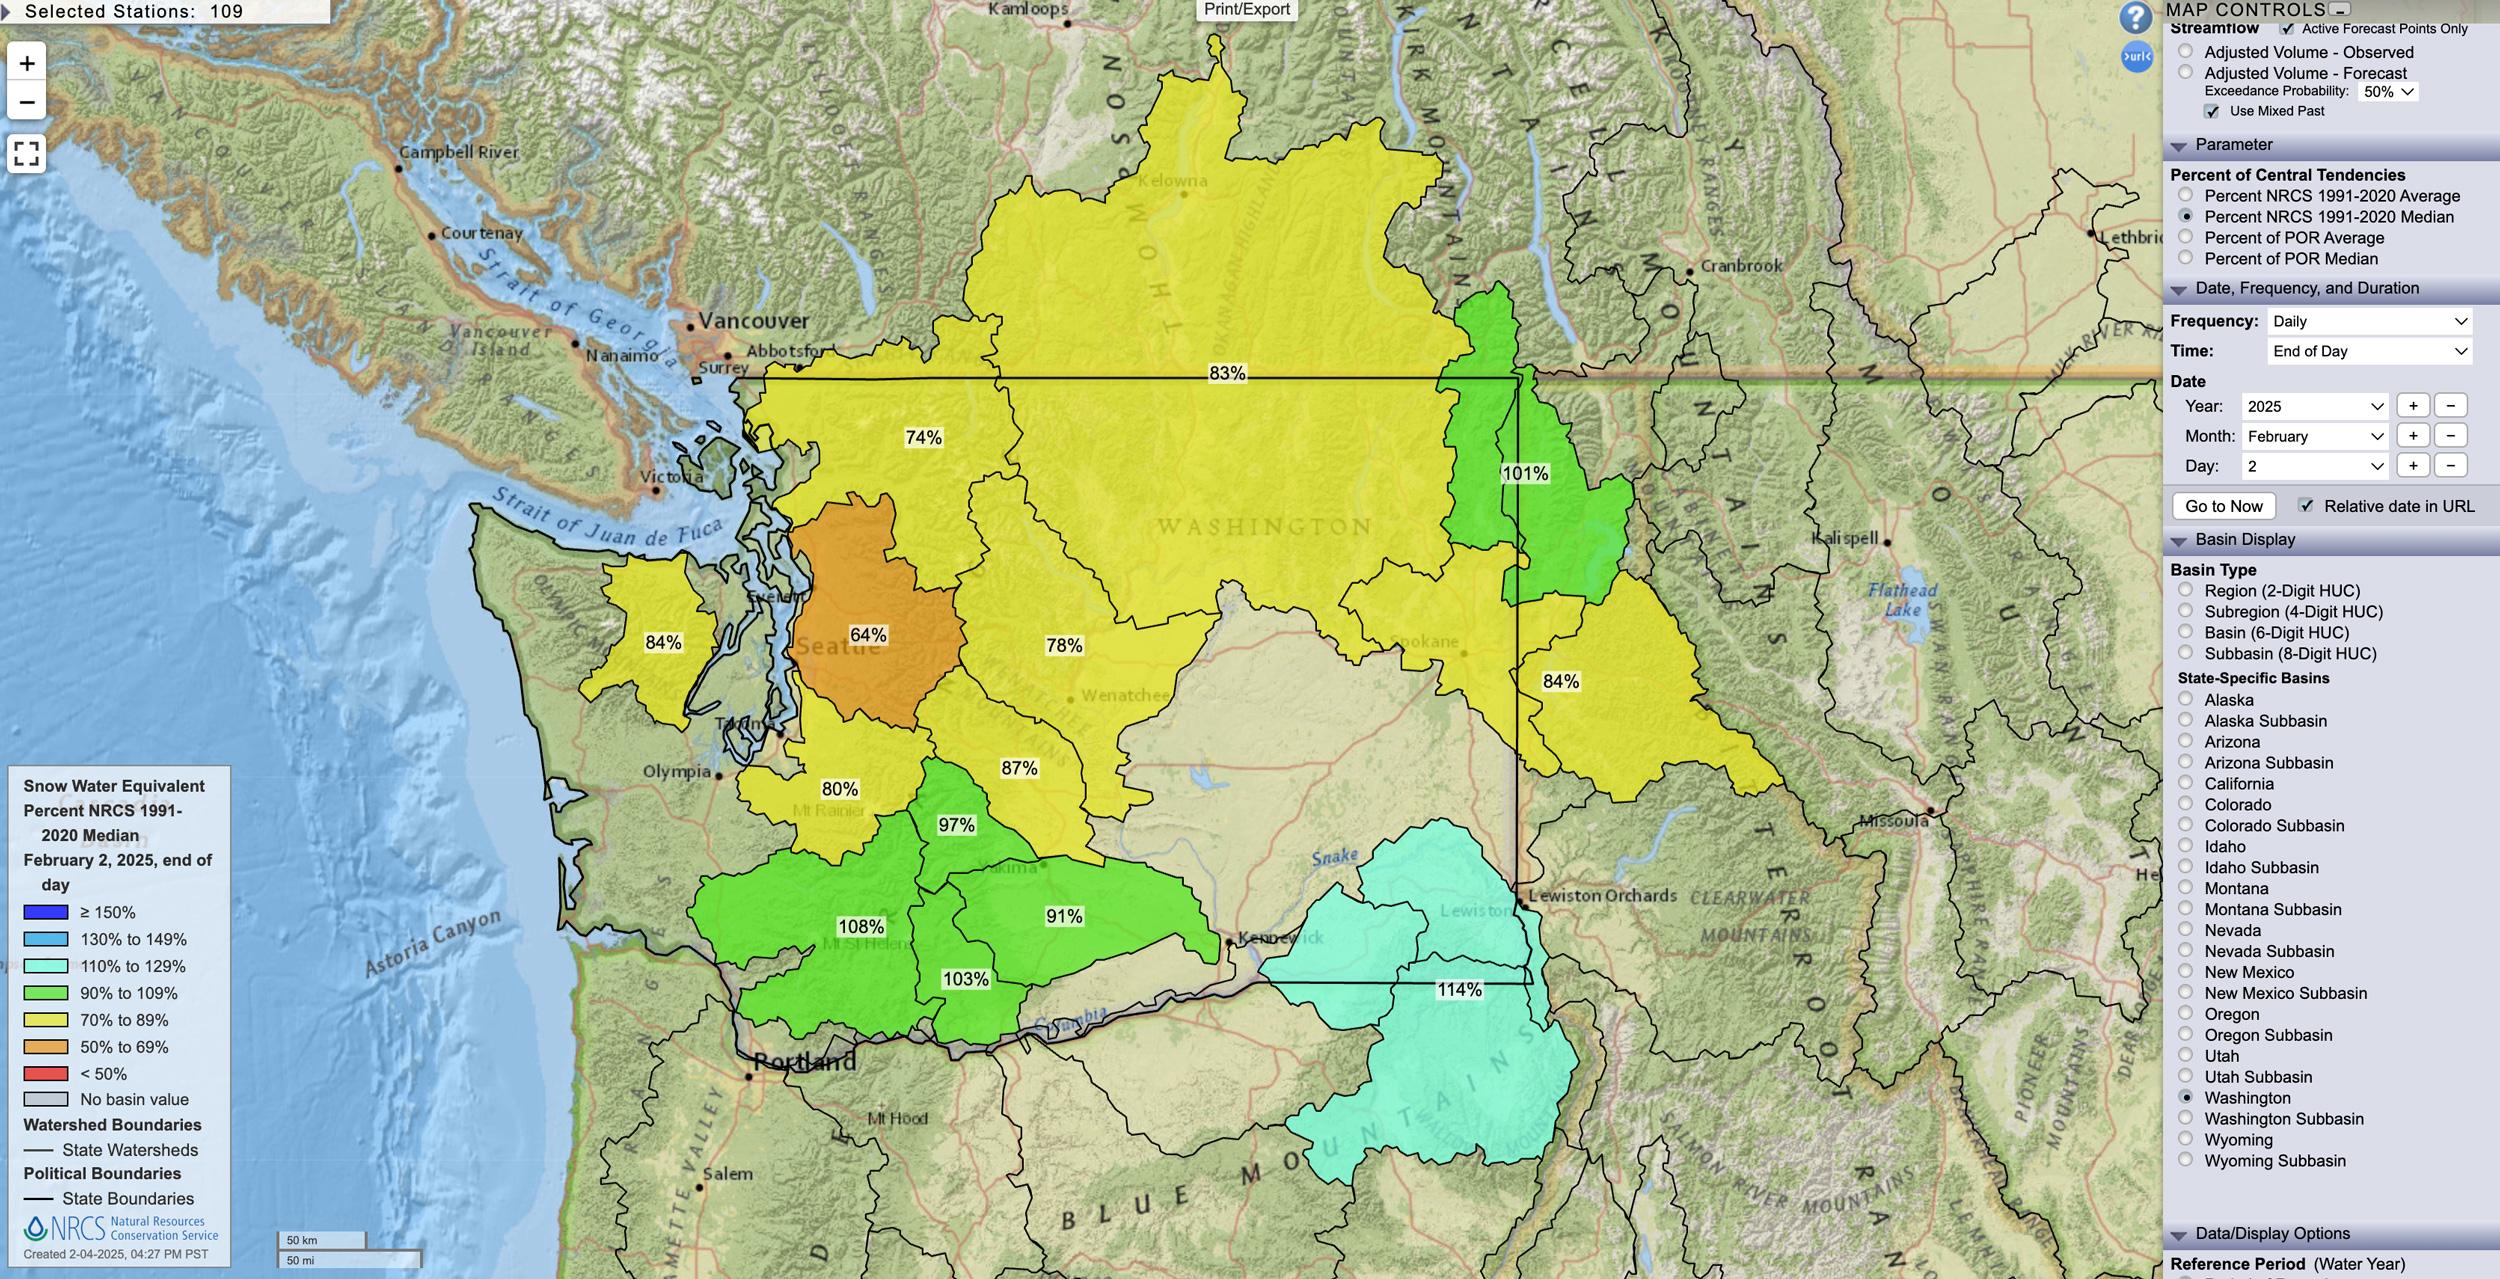
Washington February 2, 2025 snow water equivalent percent map.
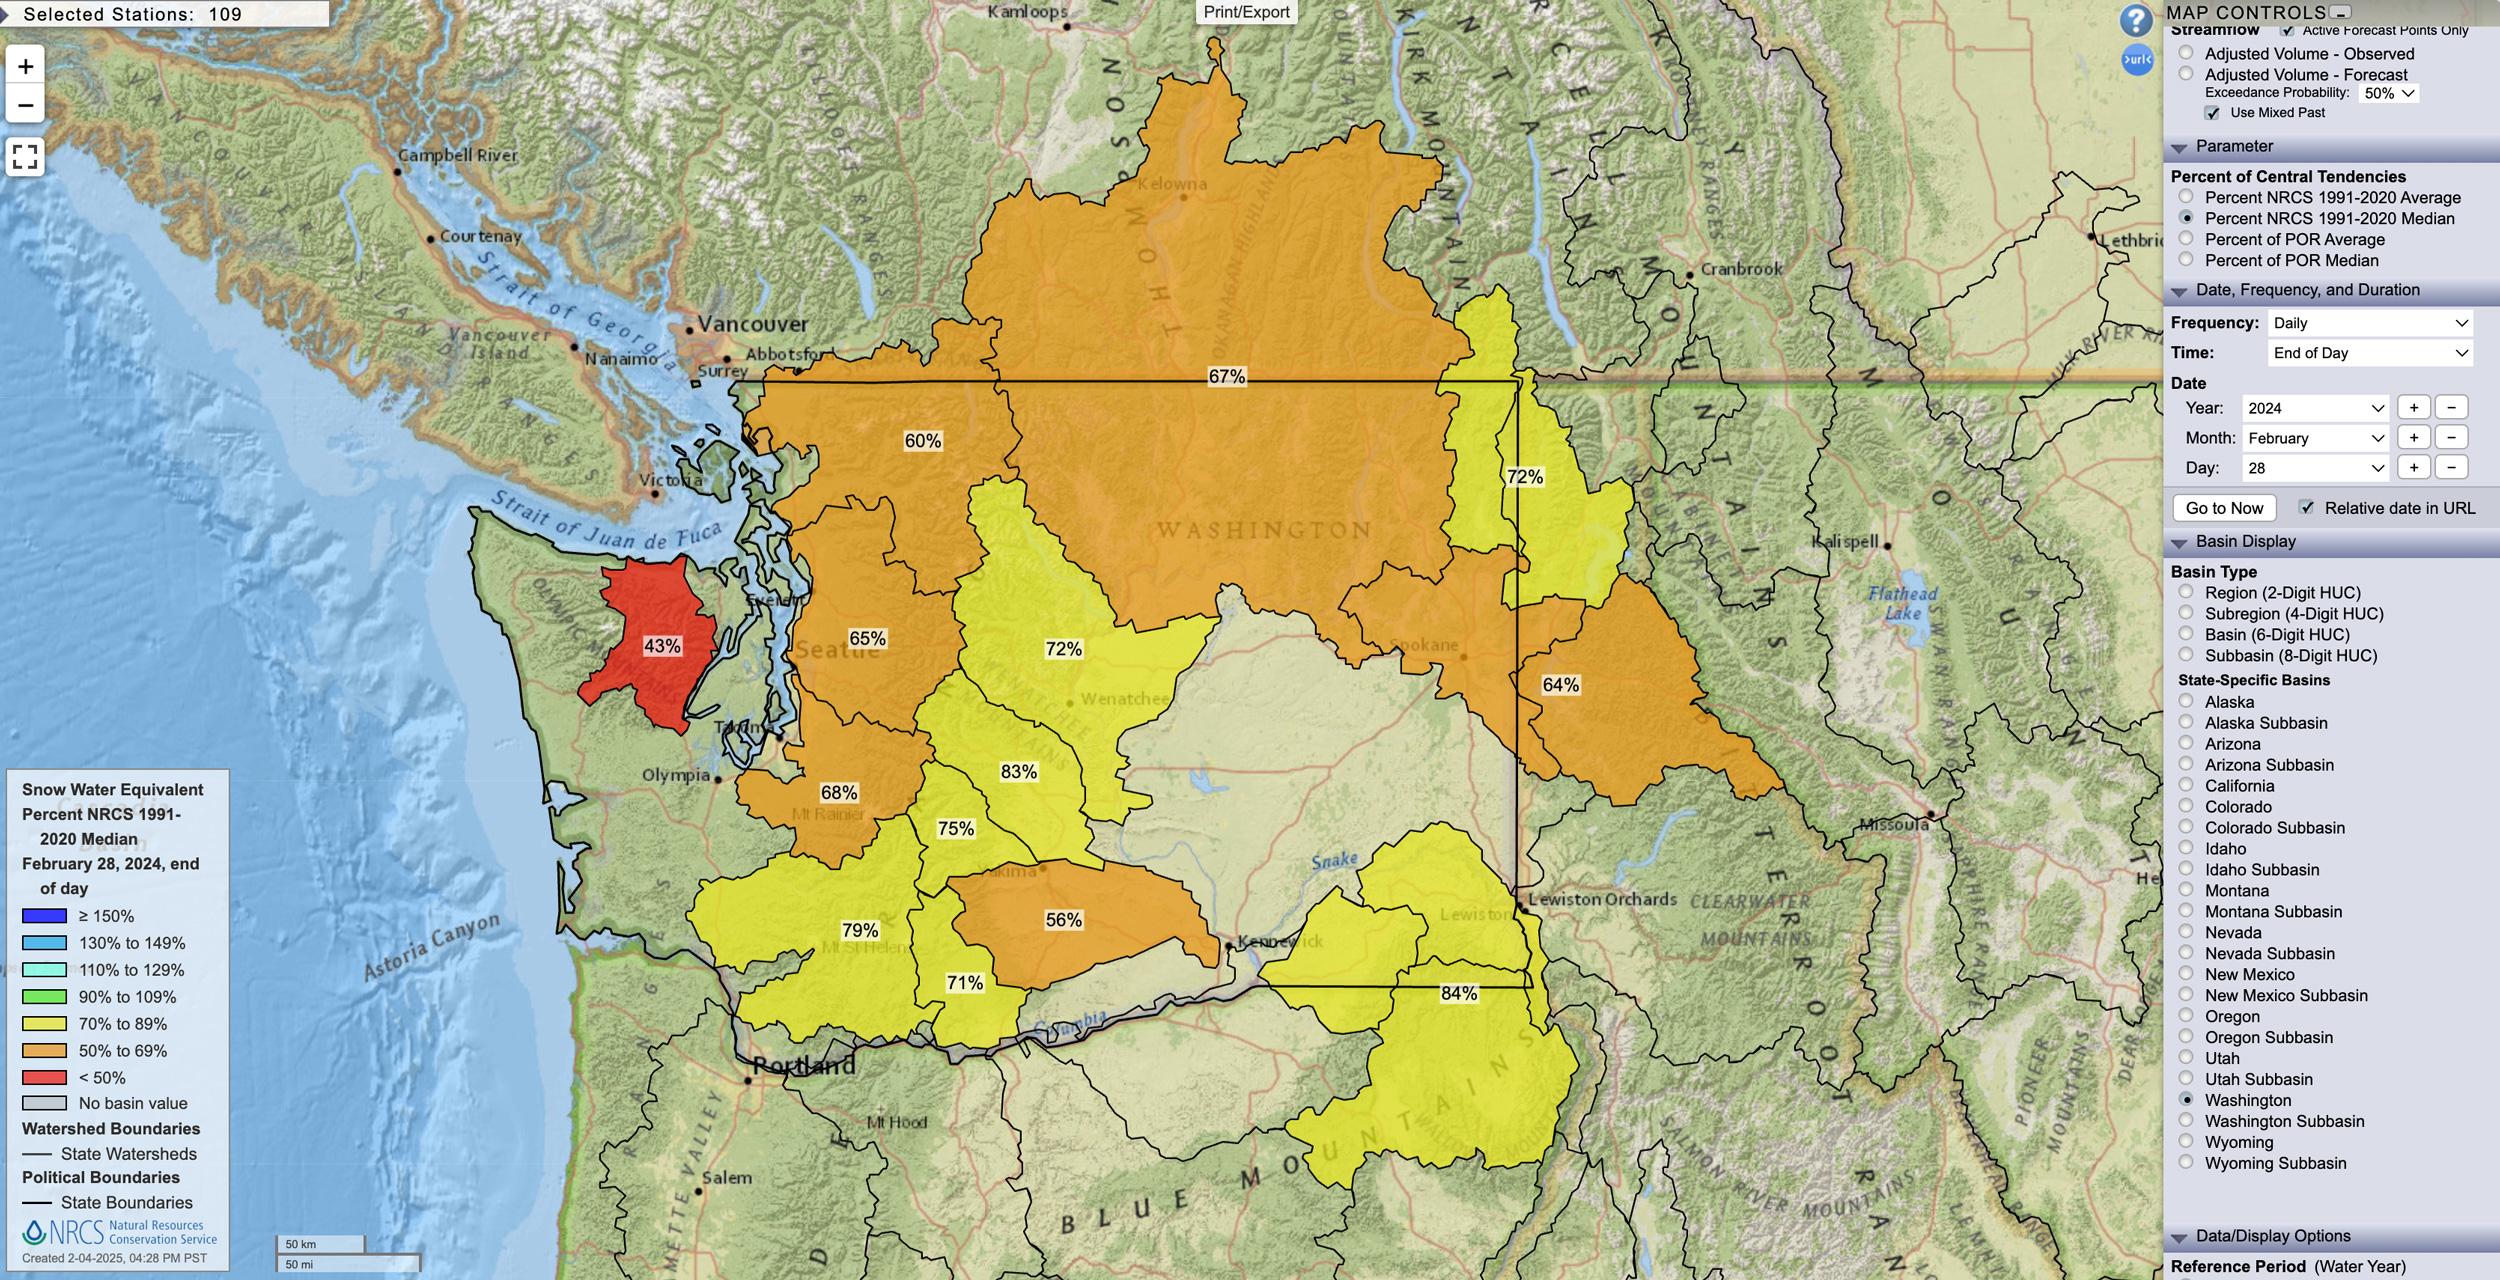
Washington February 28, 2024 snow water equivalent percent map.
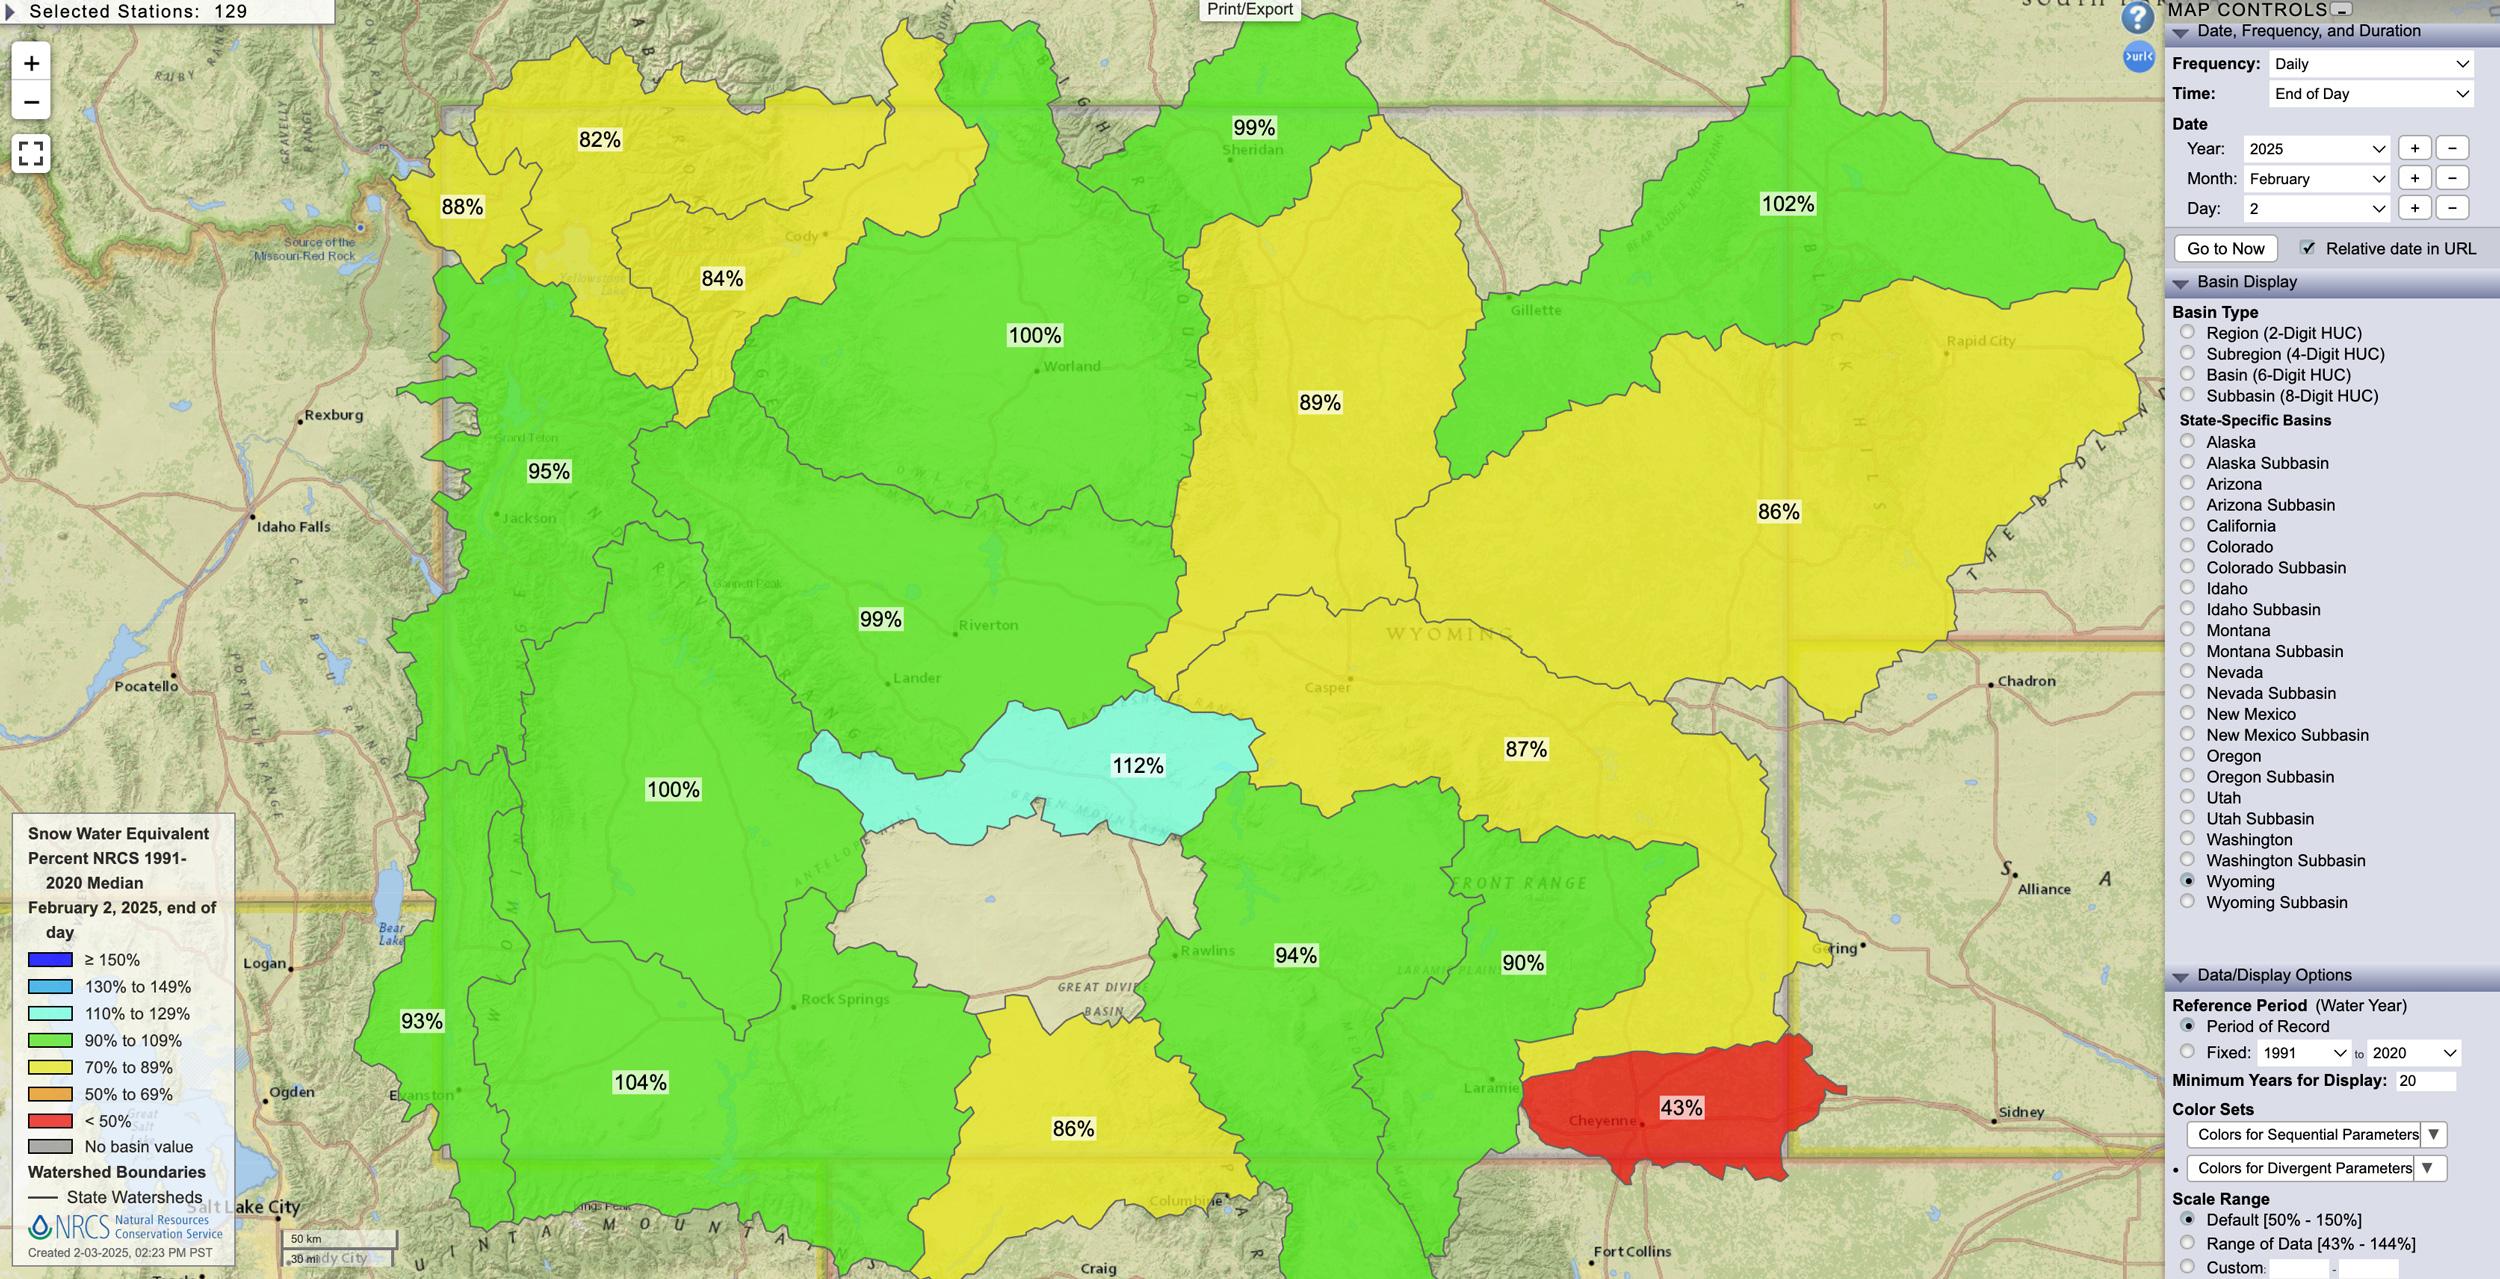
Wyoming February 2, 2025 snow water equivalent percent map.
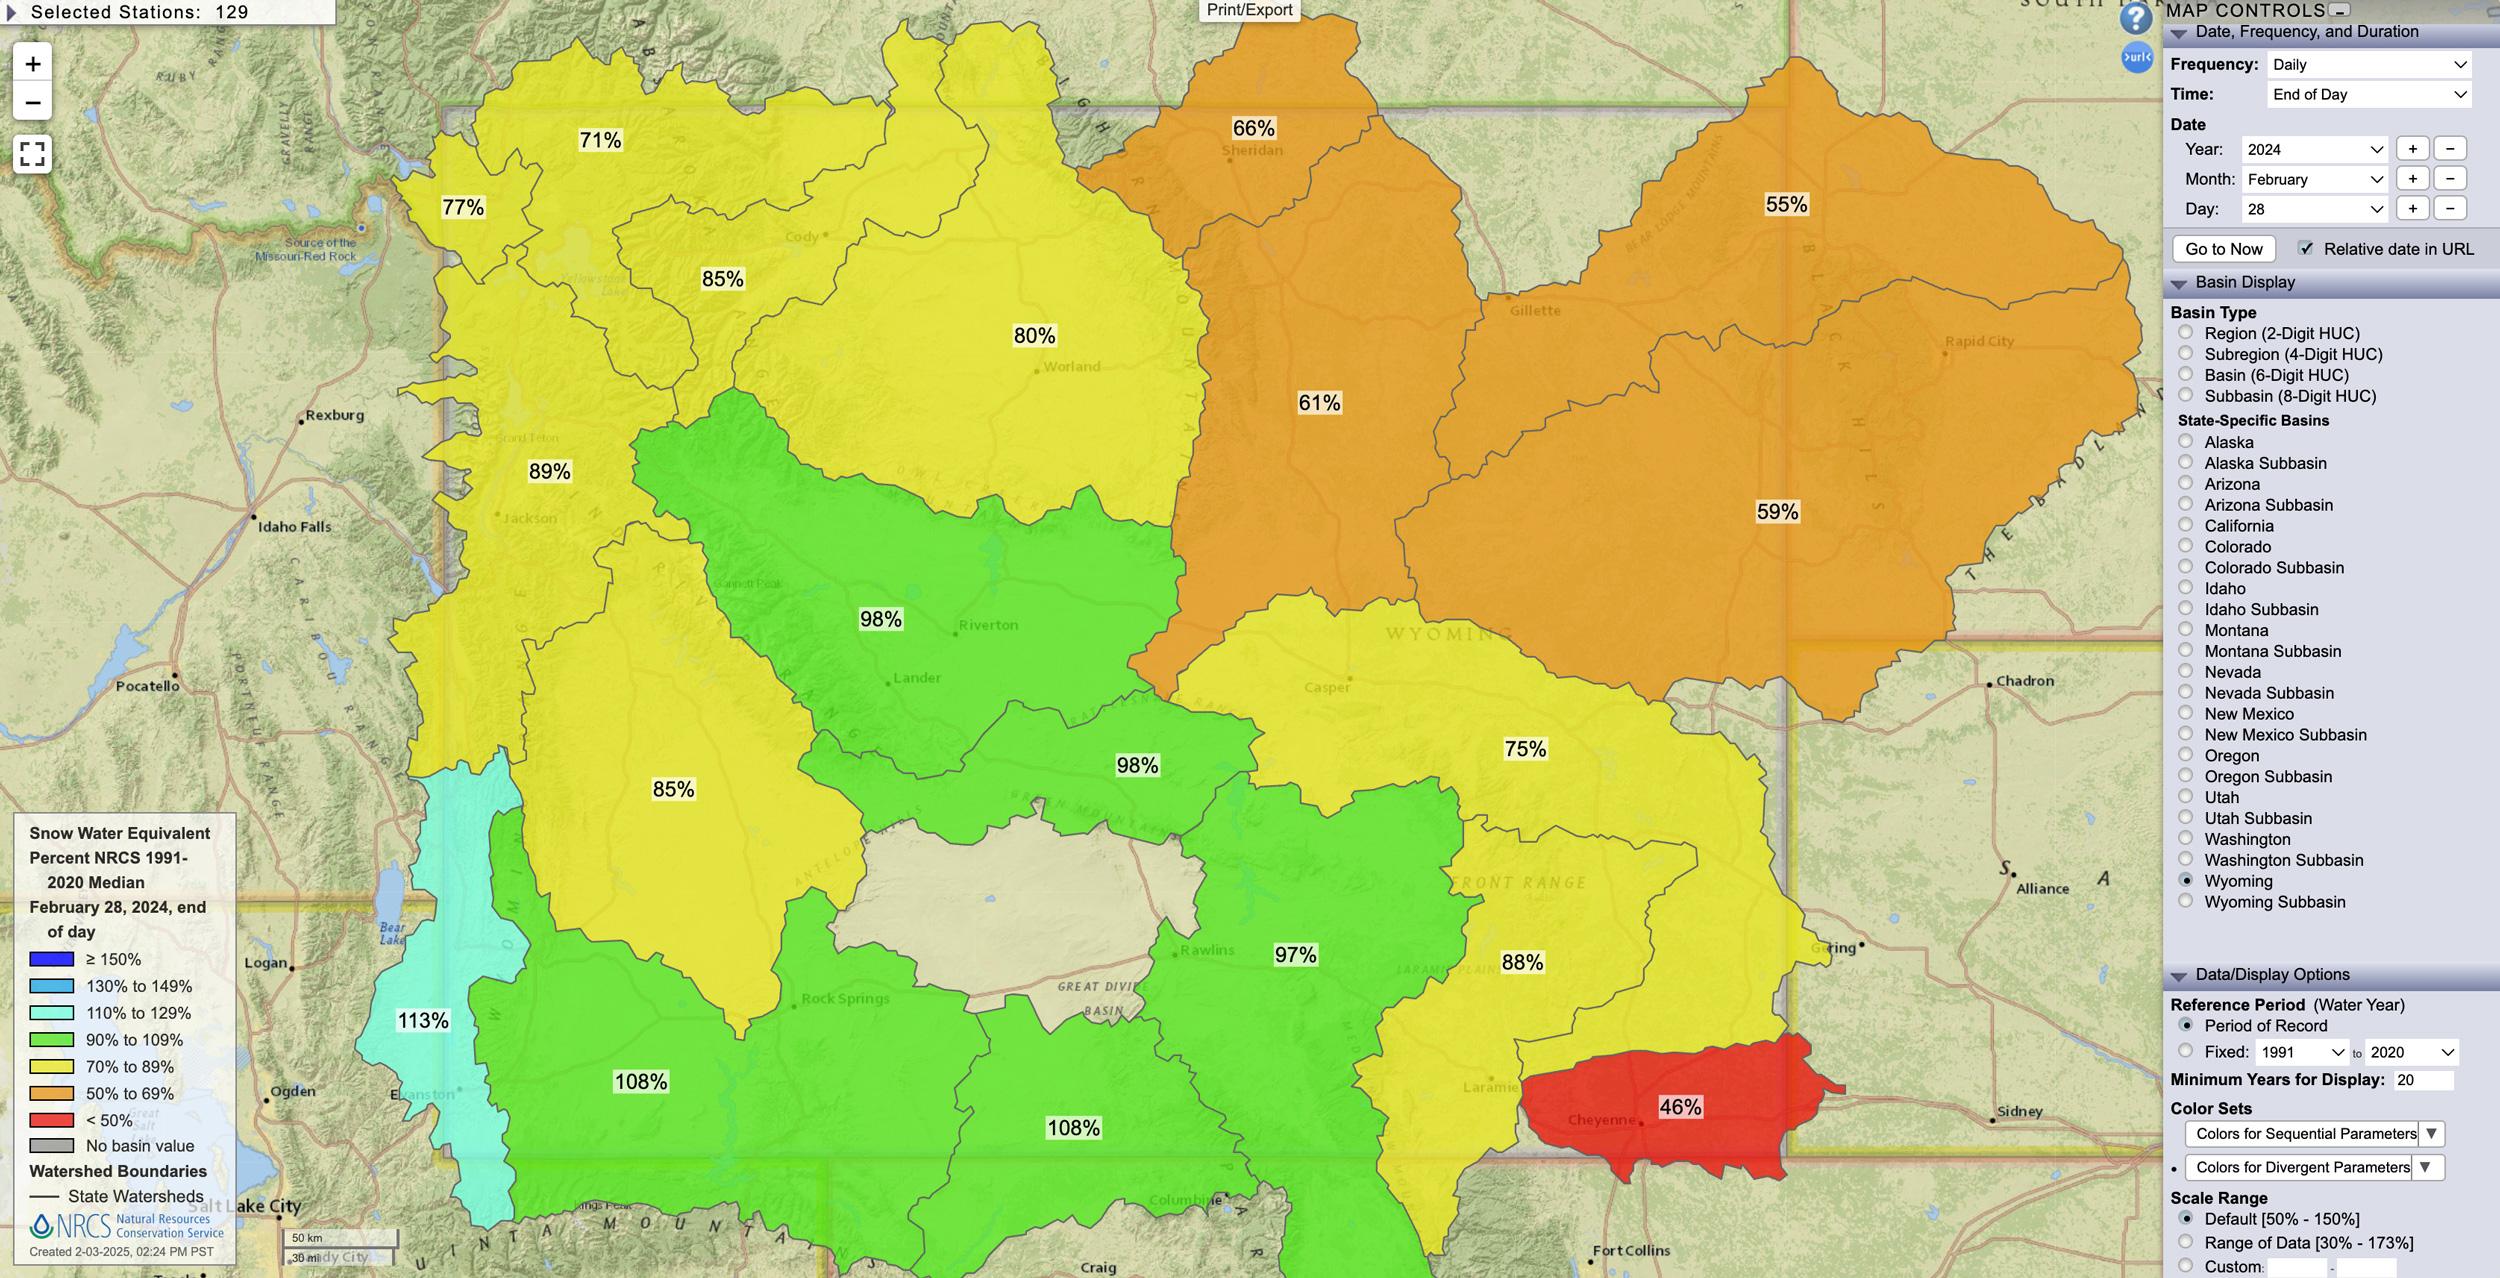
Wyoming February 28, 2024 snow water equivalent percent map.
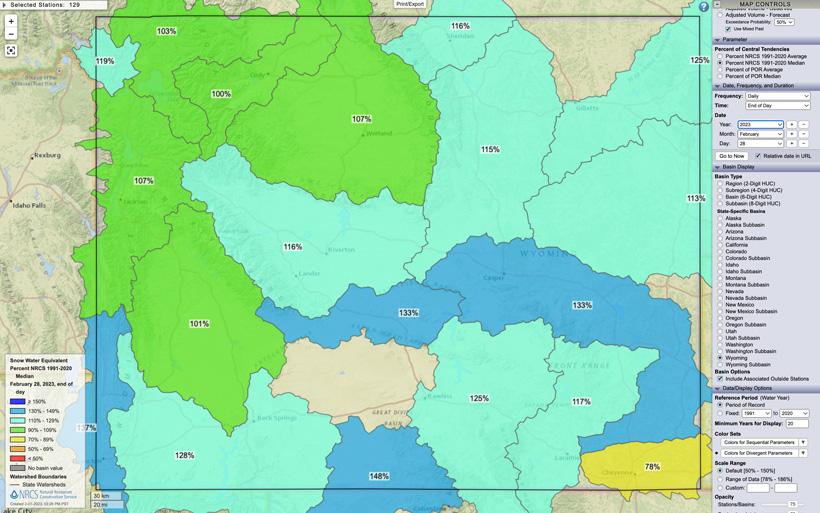
Wyoming February 28, 2023 snow water equivalent percent map.
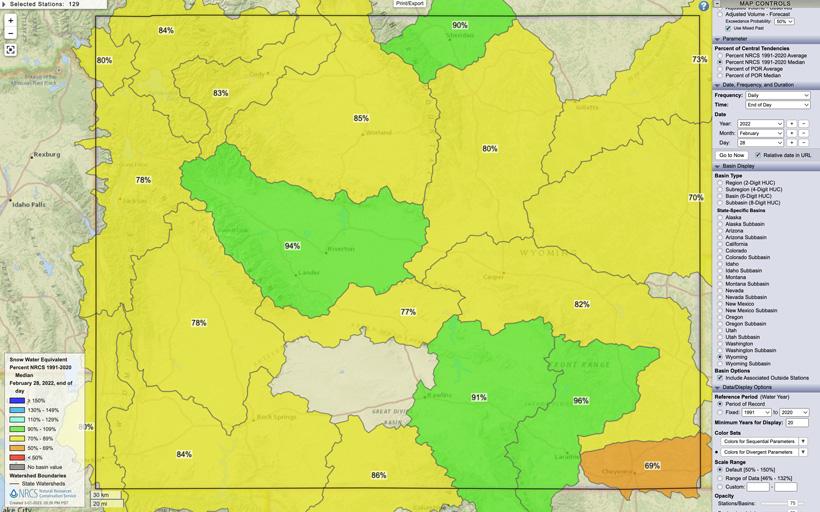
Wyoming February 28, 2022 snow water equivalent percent map.
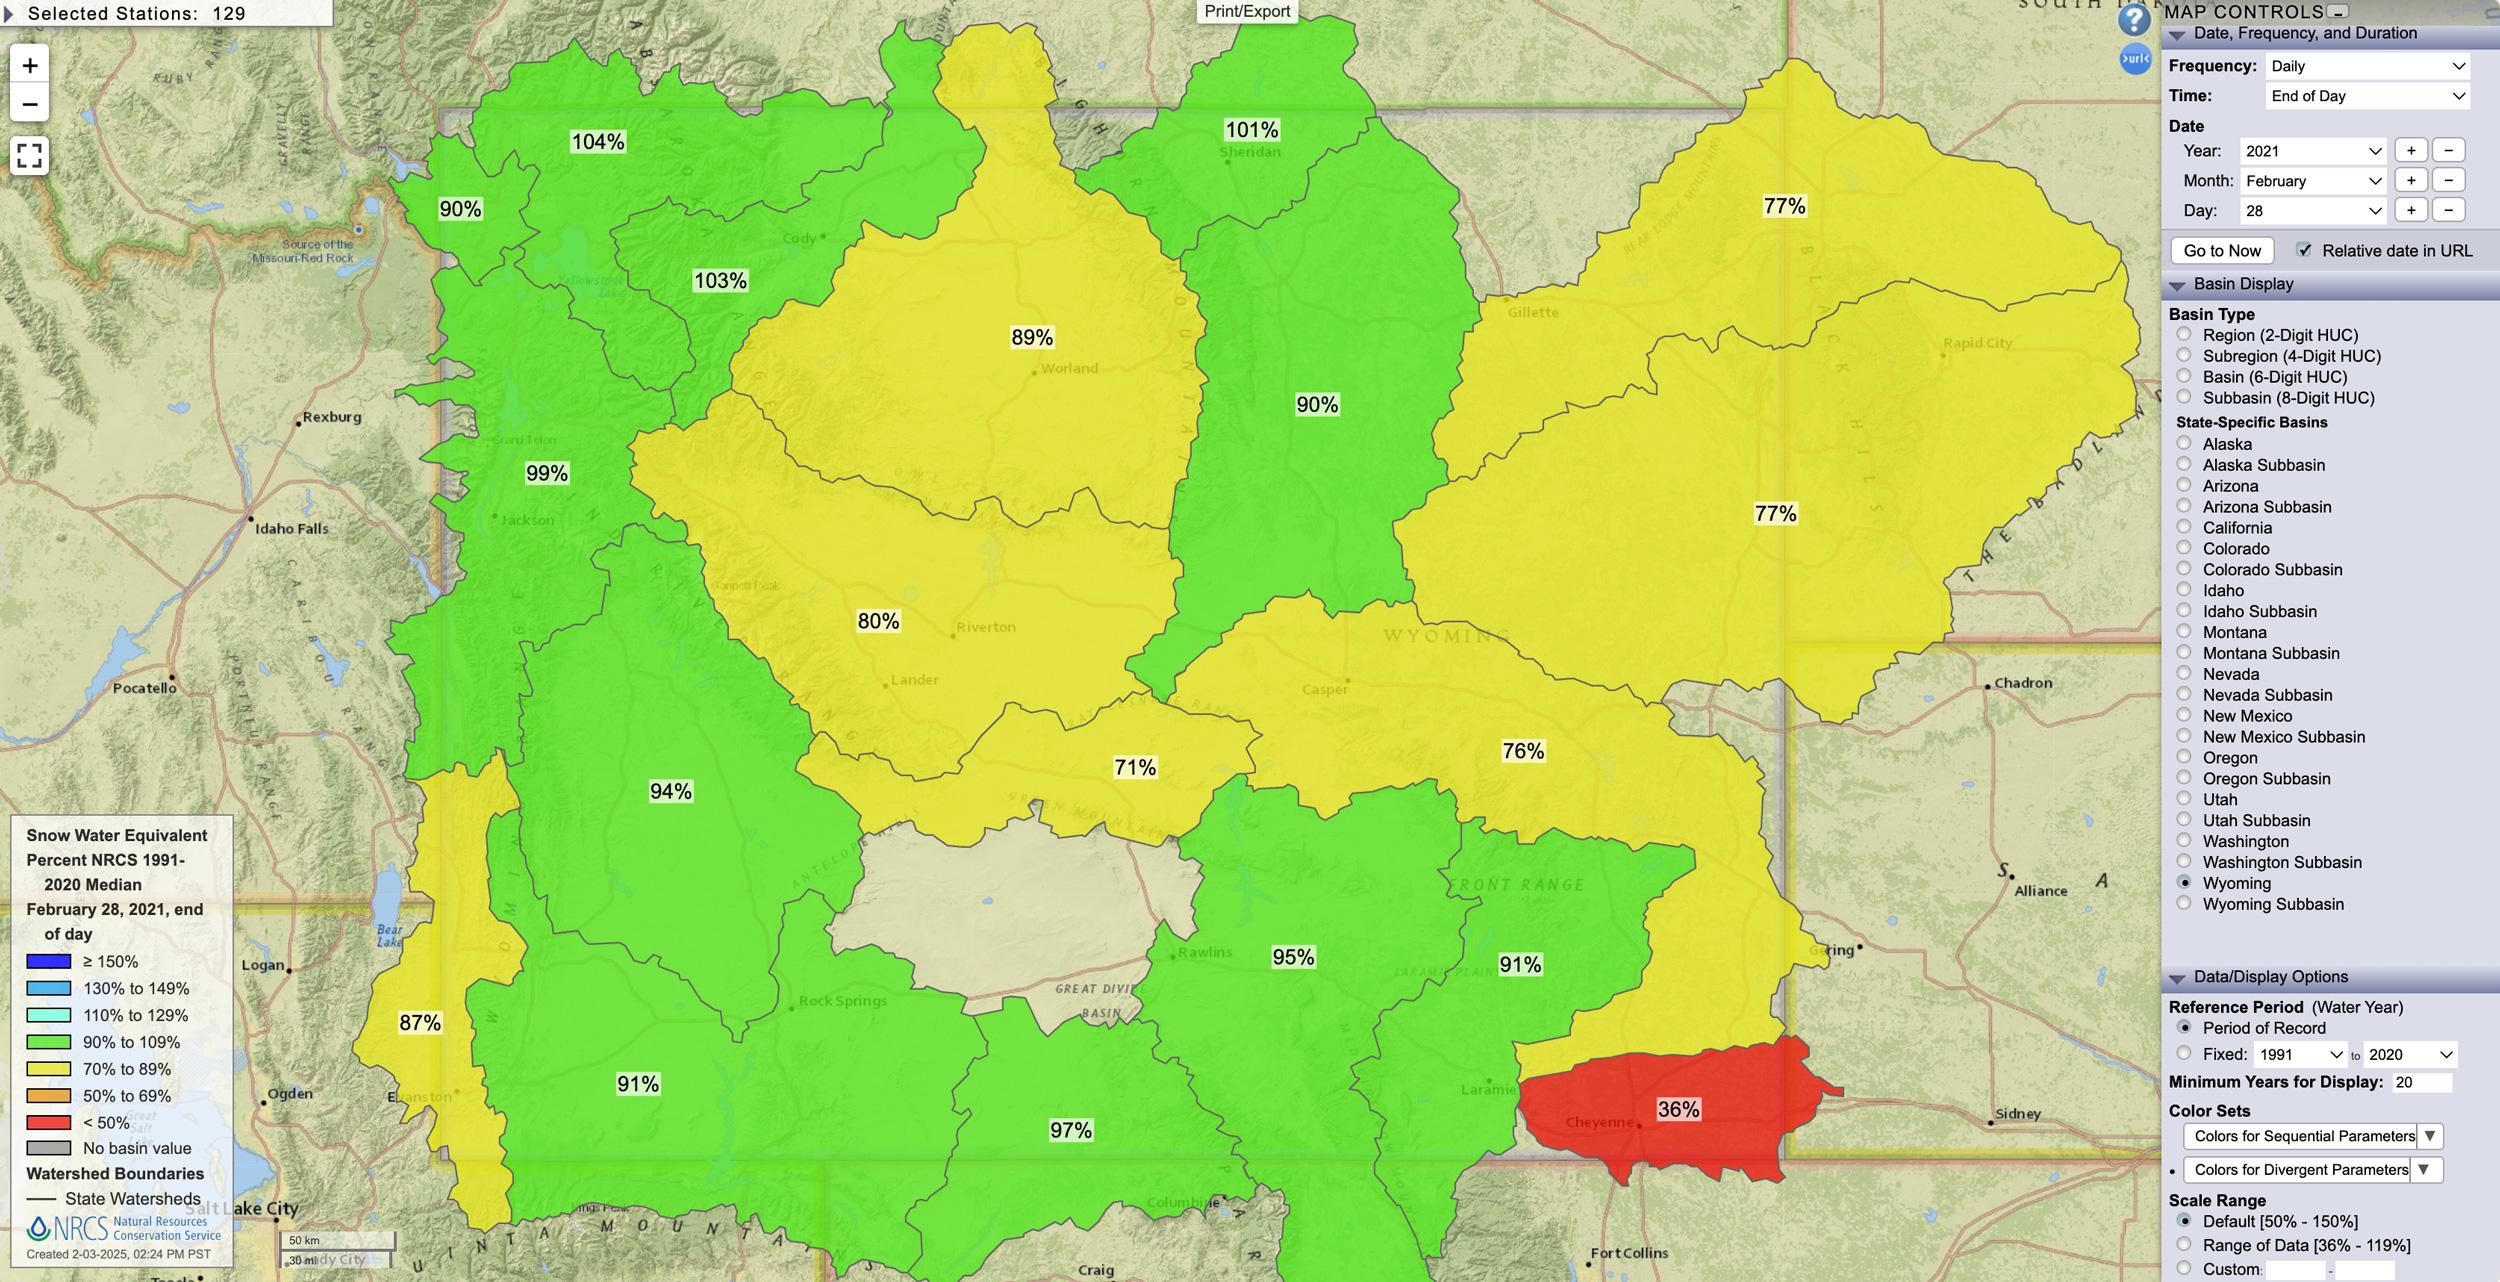
Wyoming February 28, 2021 snow water equivalent percent map.
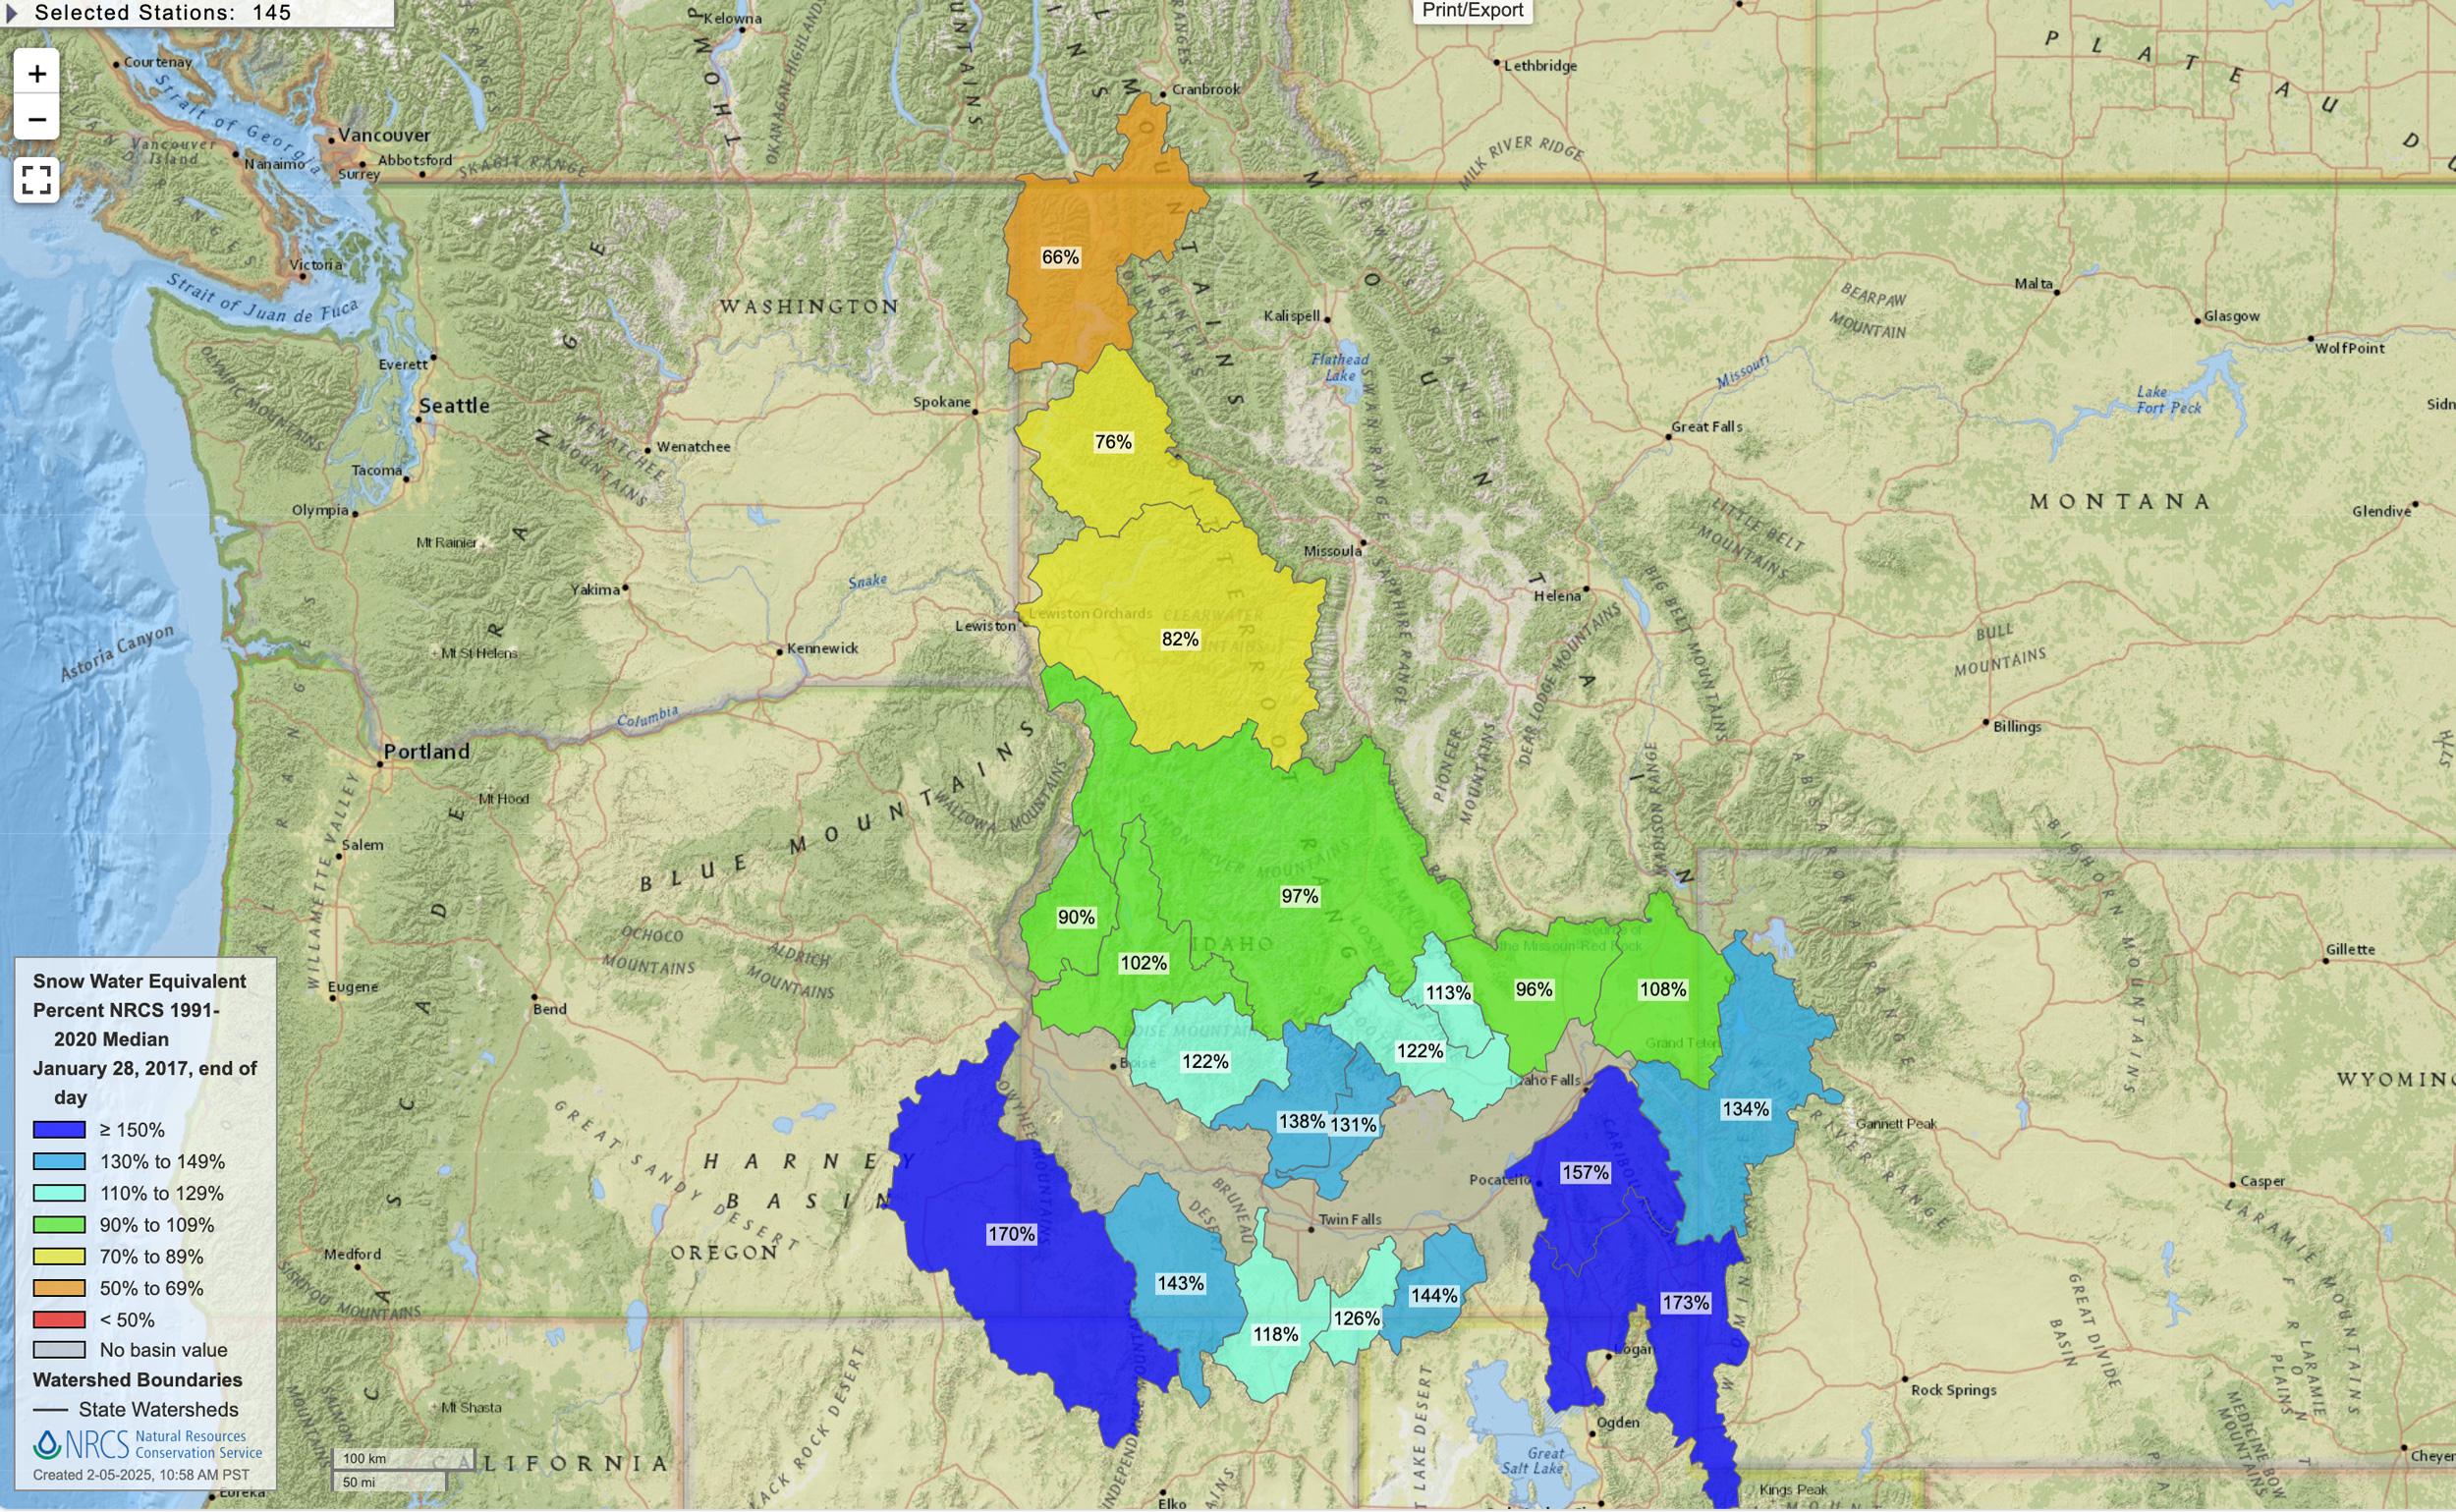
Idaho January 28, 2017 snow water equivalent percent map.
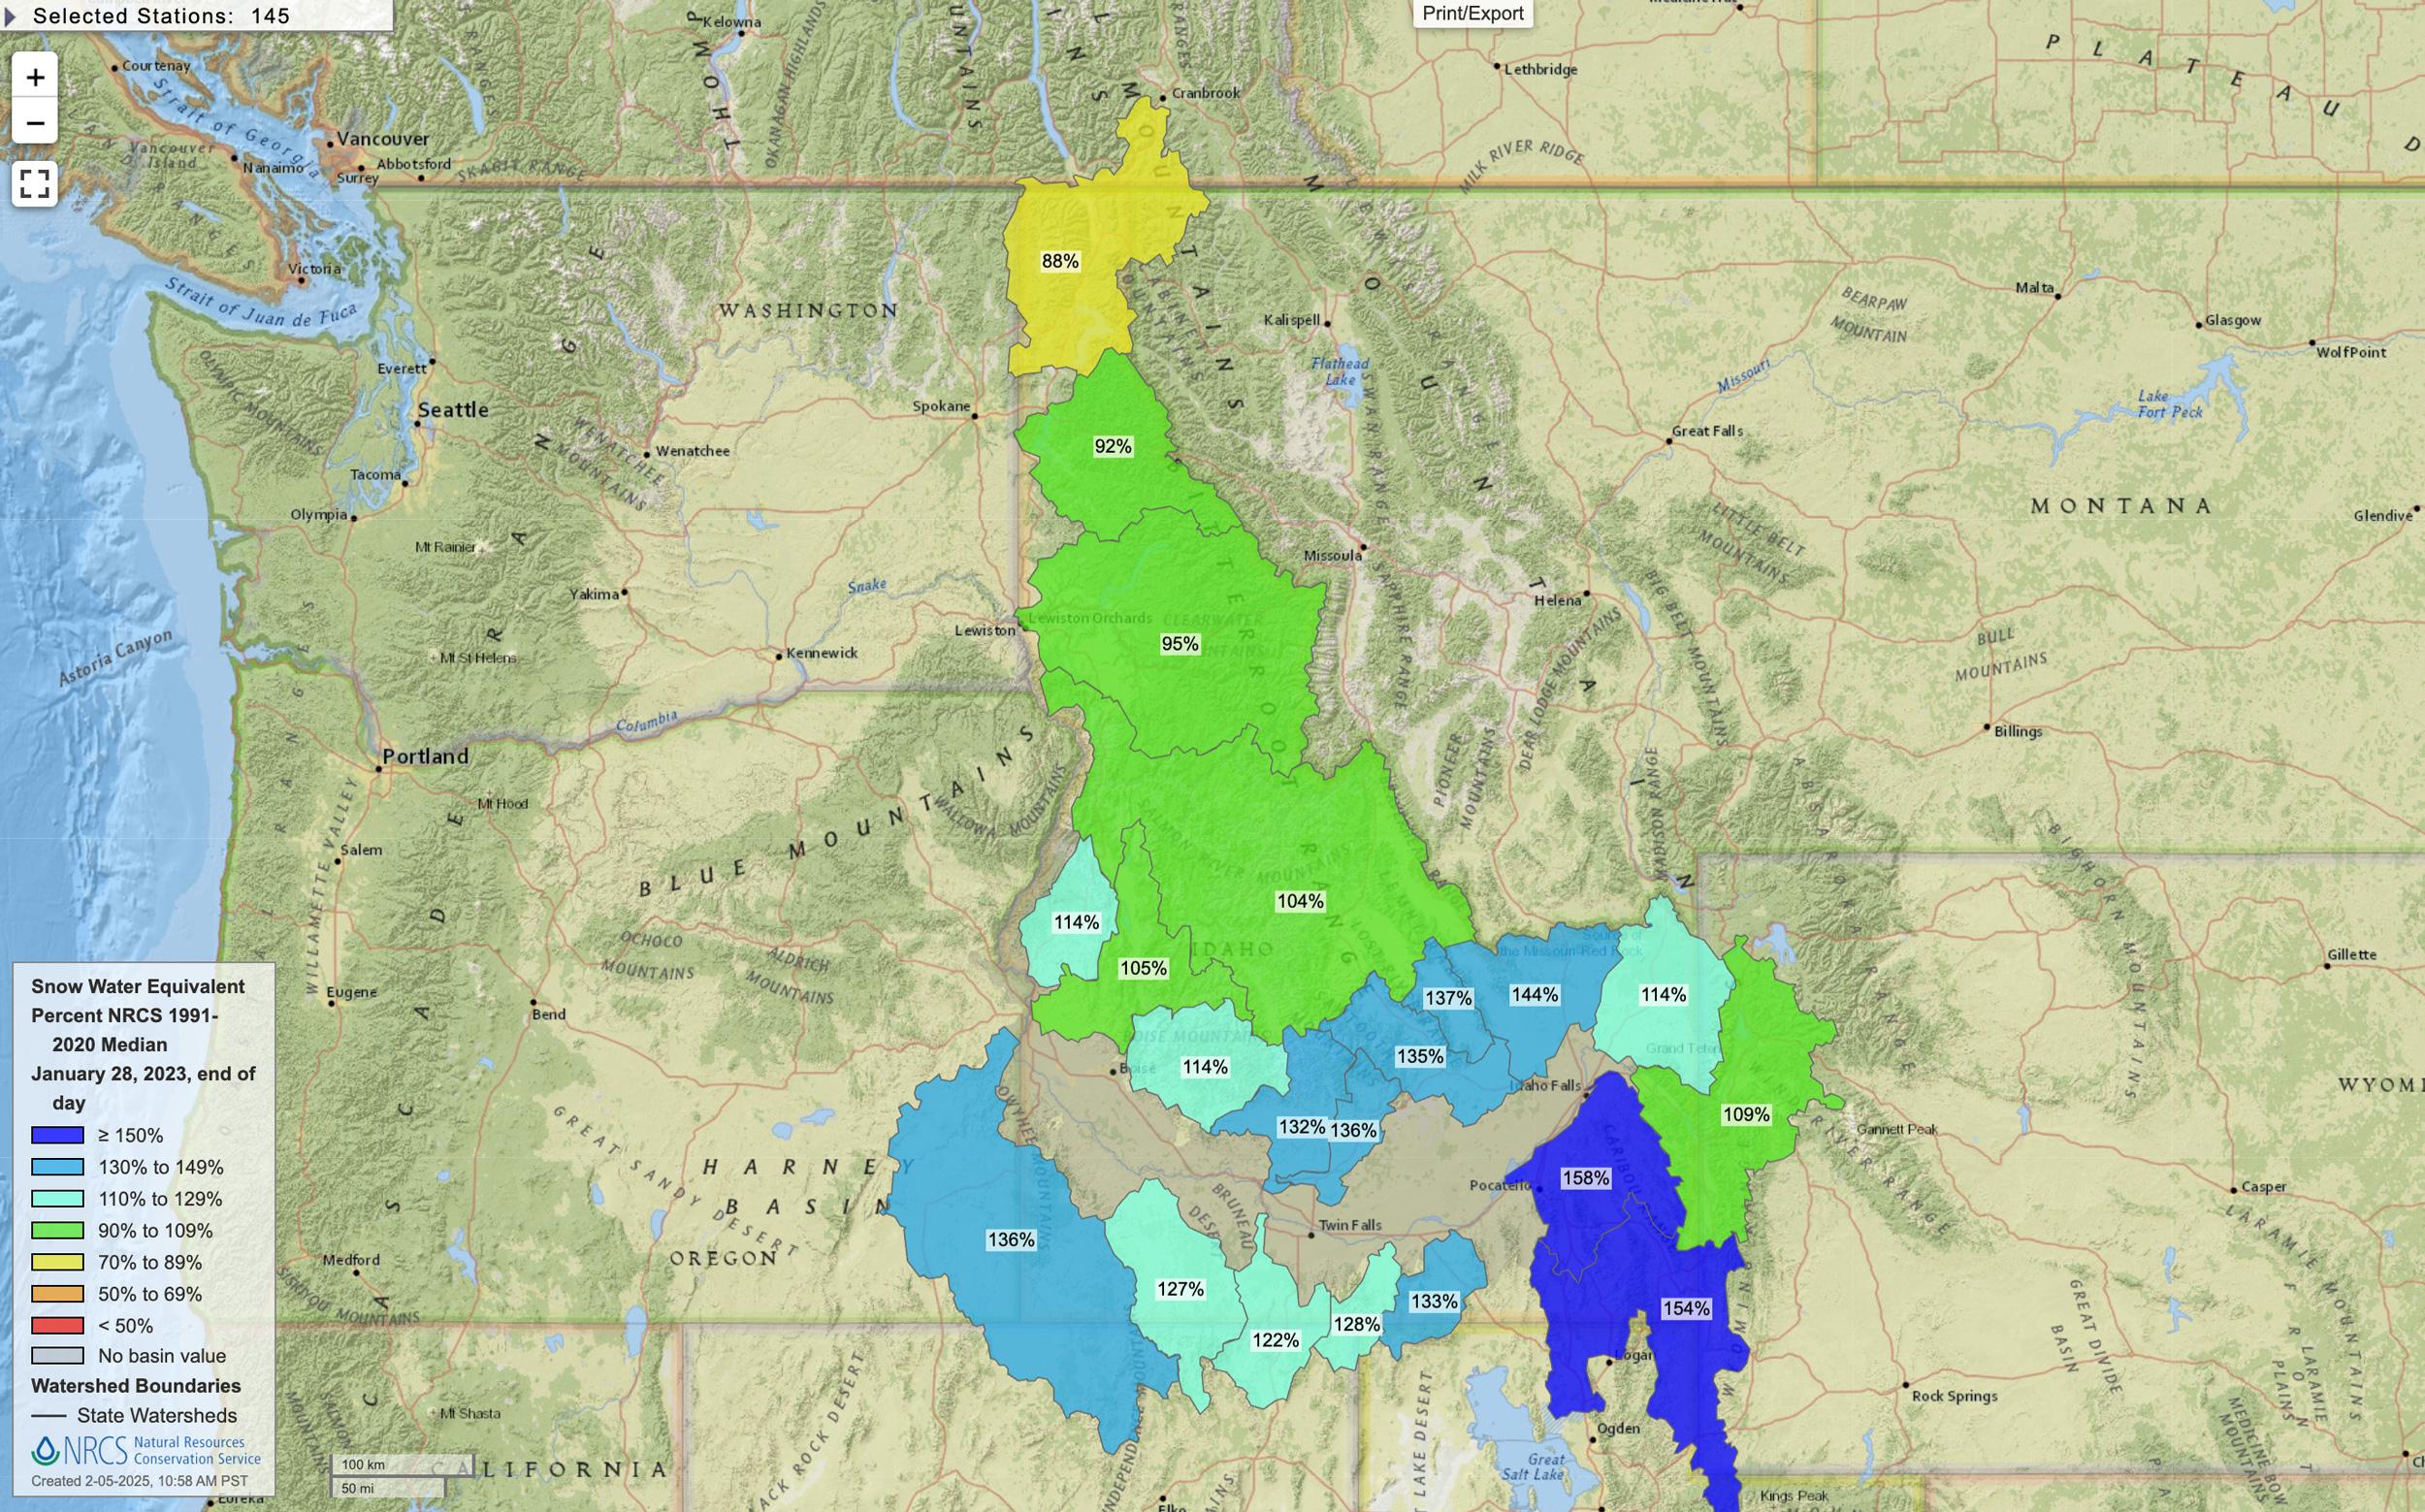
Idaho January 28, 2023 snow water equivalent percent map.
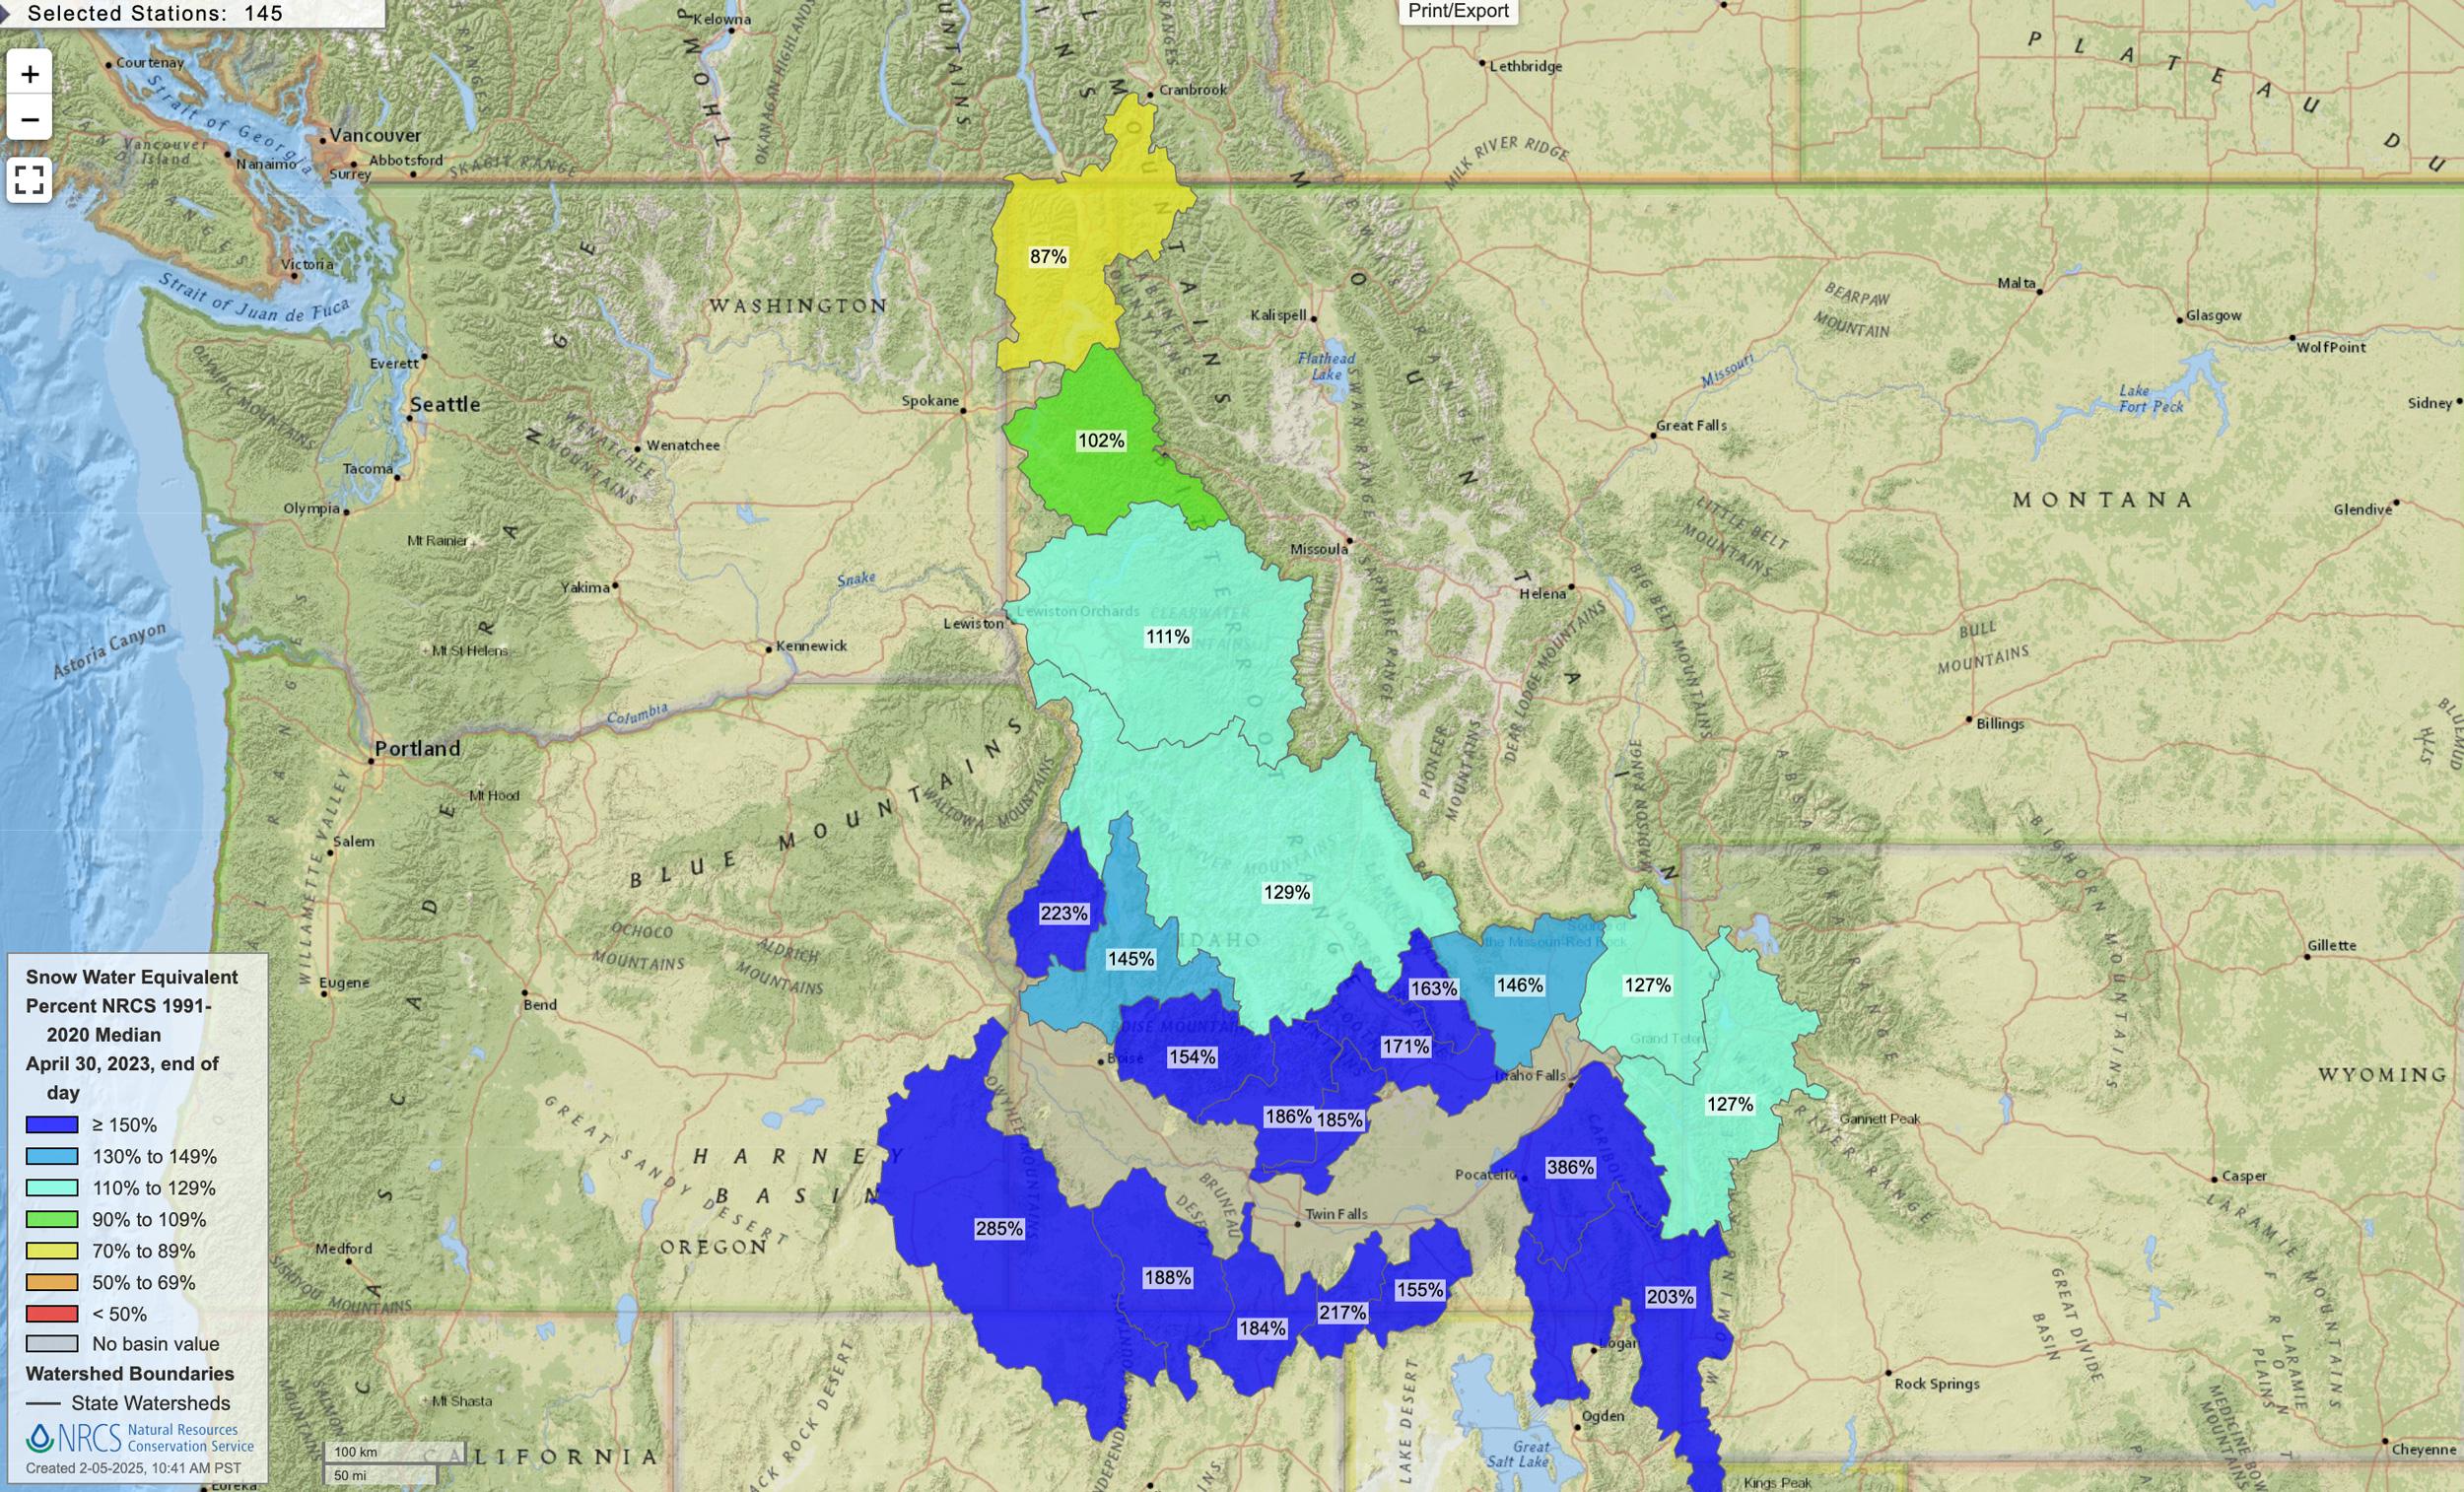
Idaho April 30, 2023 snow water equivalent percent map.
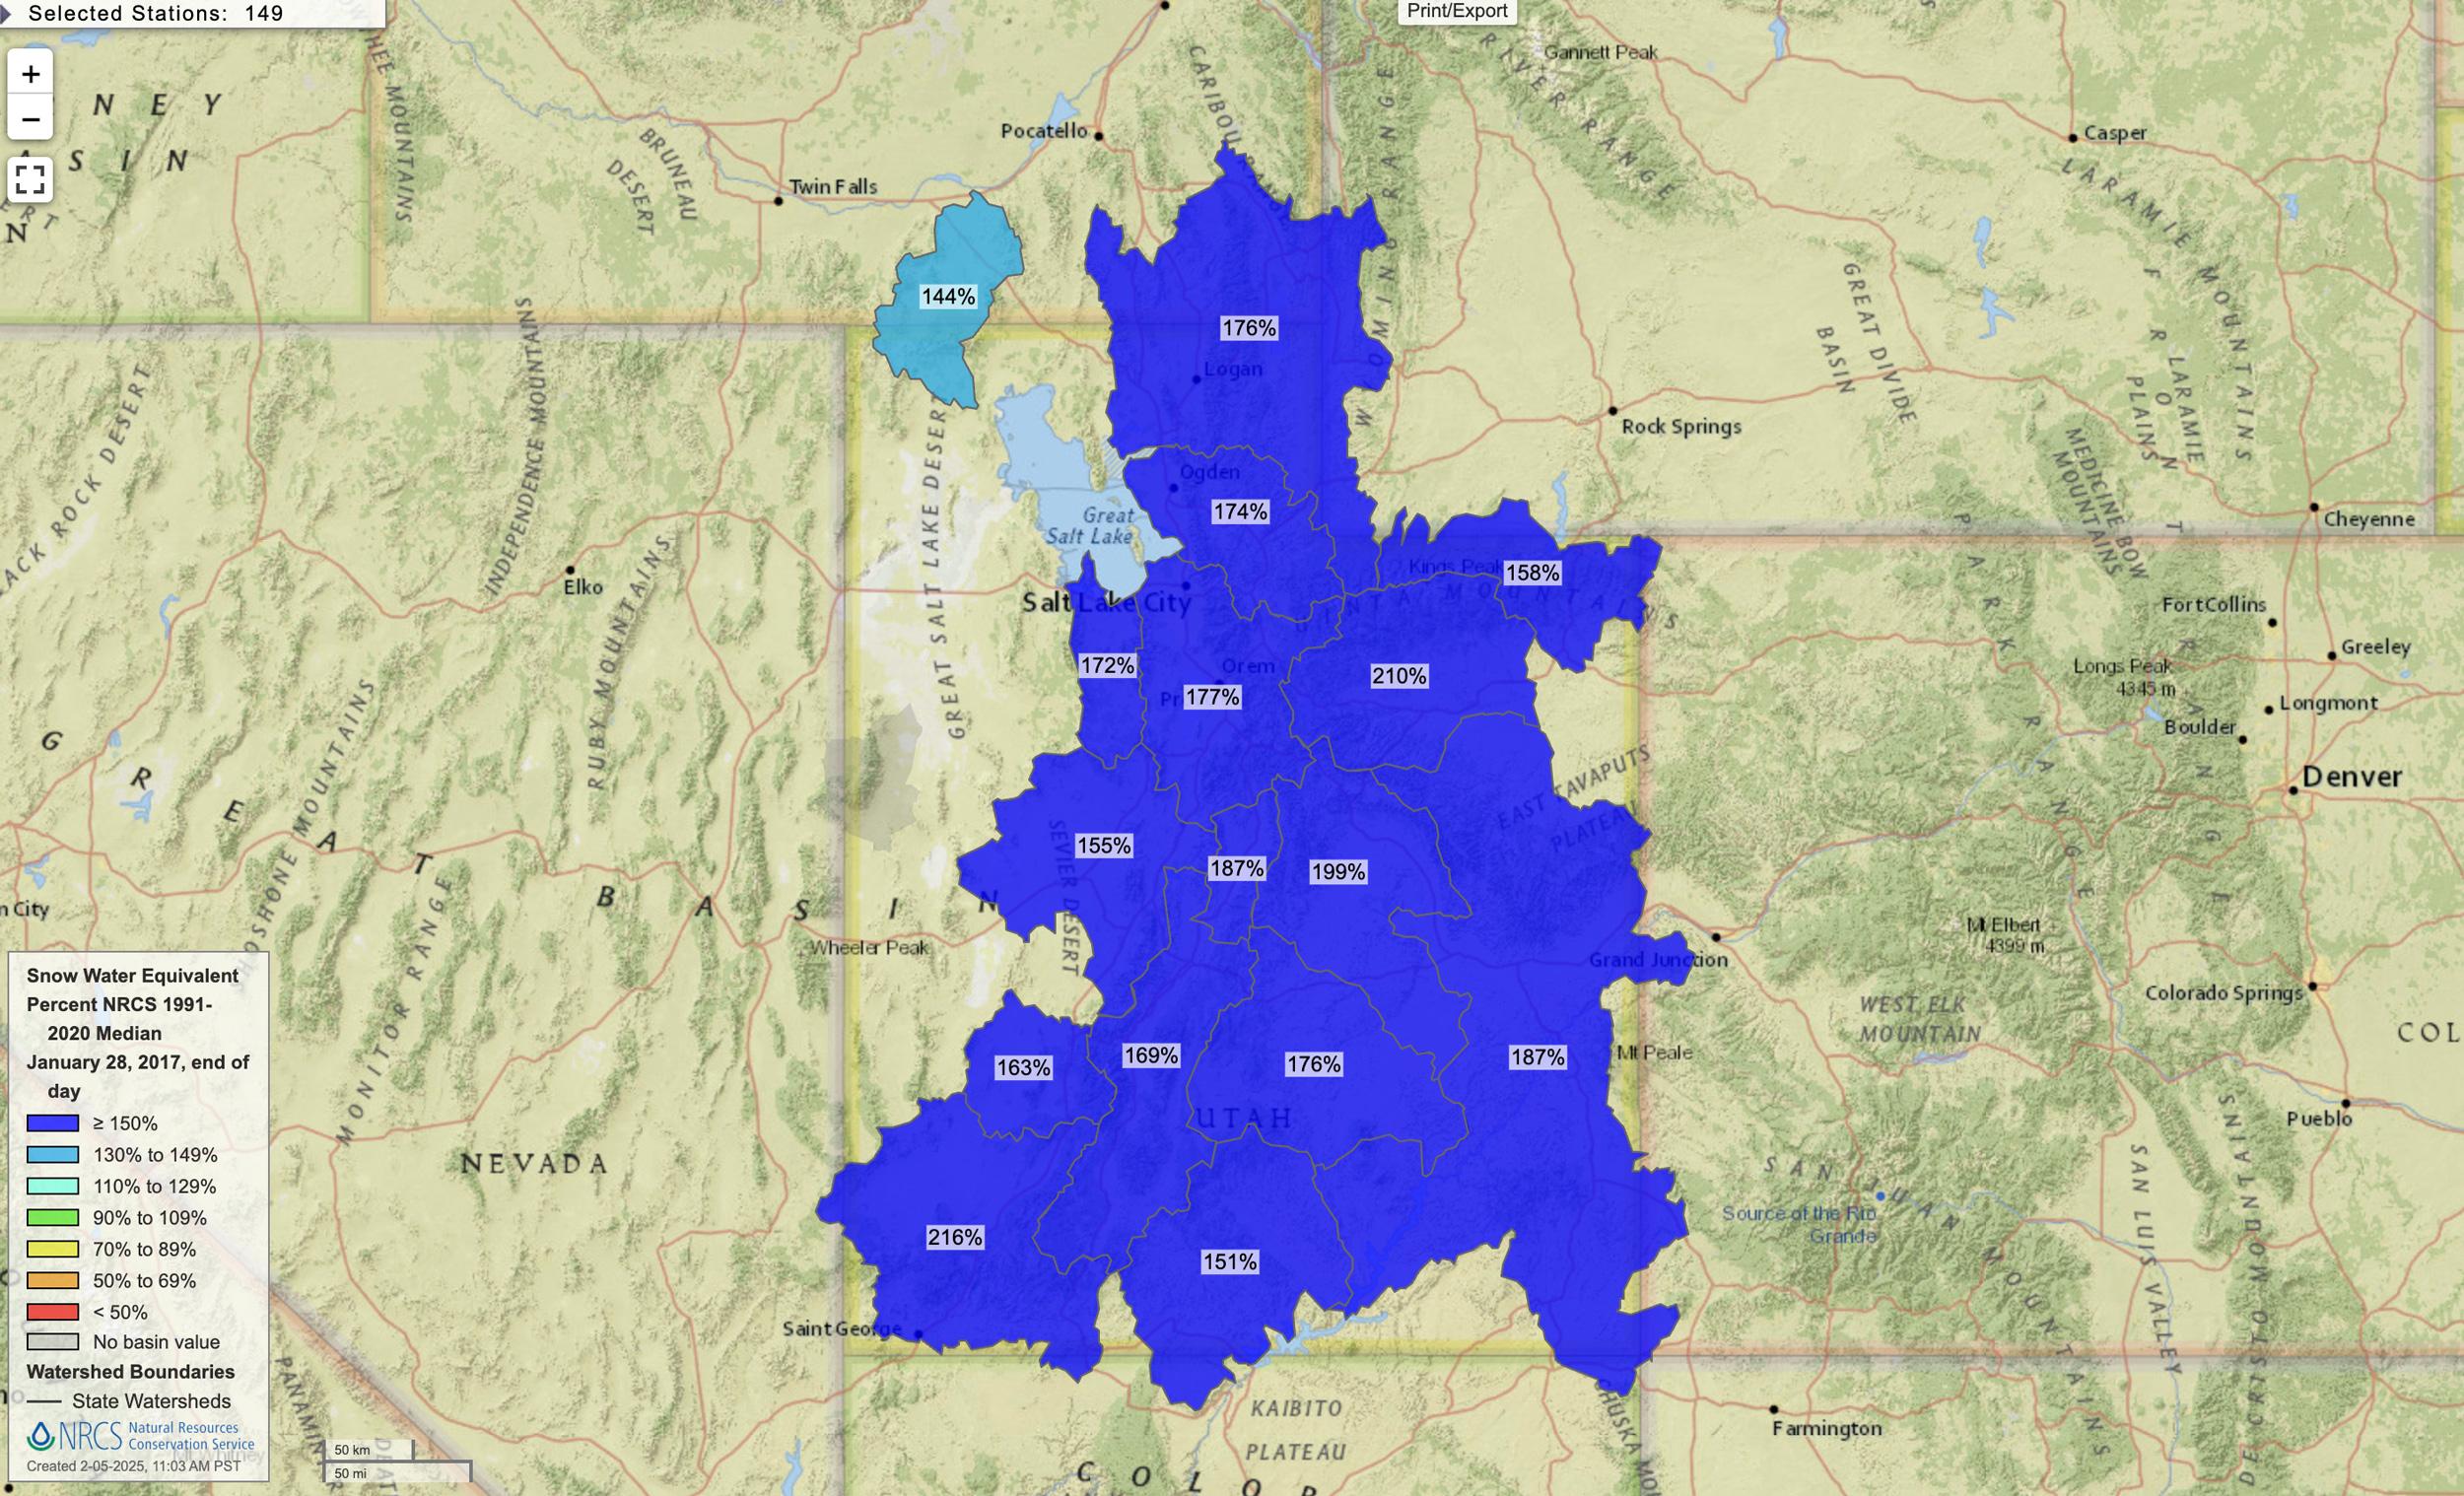
Utah January 28, 2017 snow water equivalent percent map.
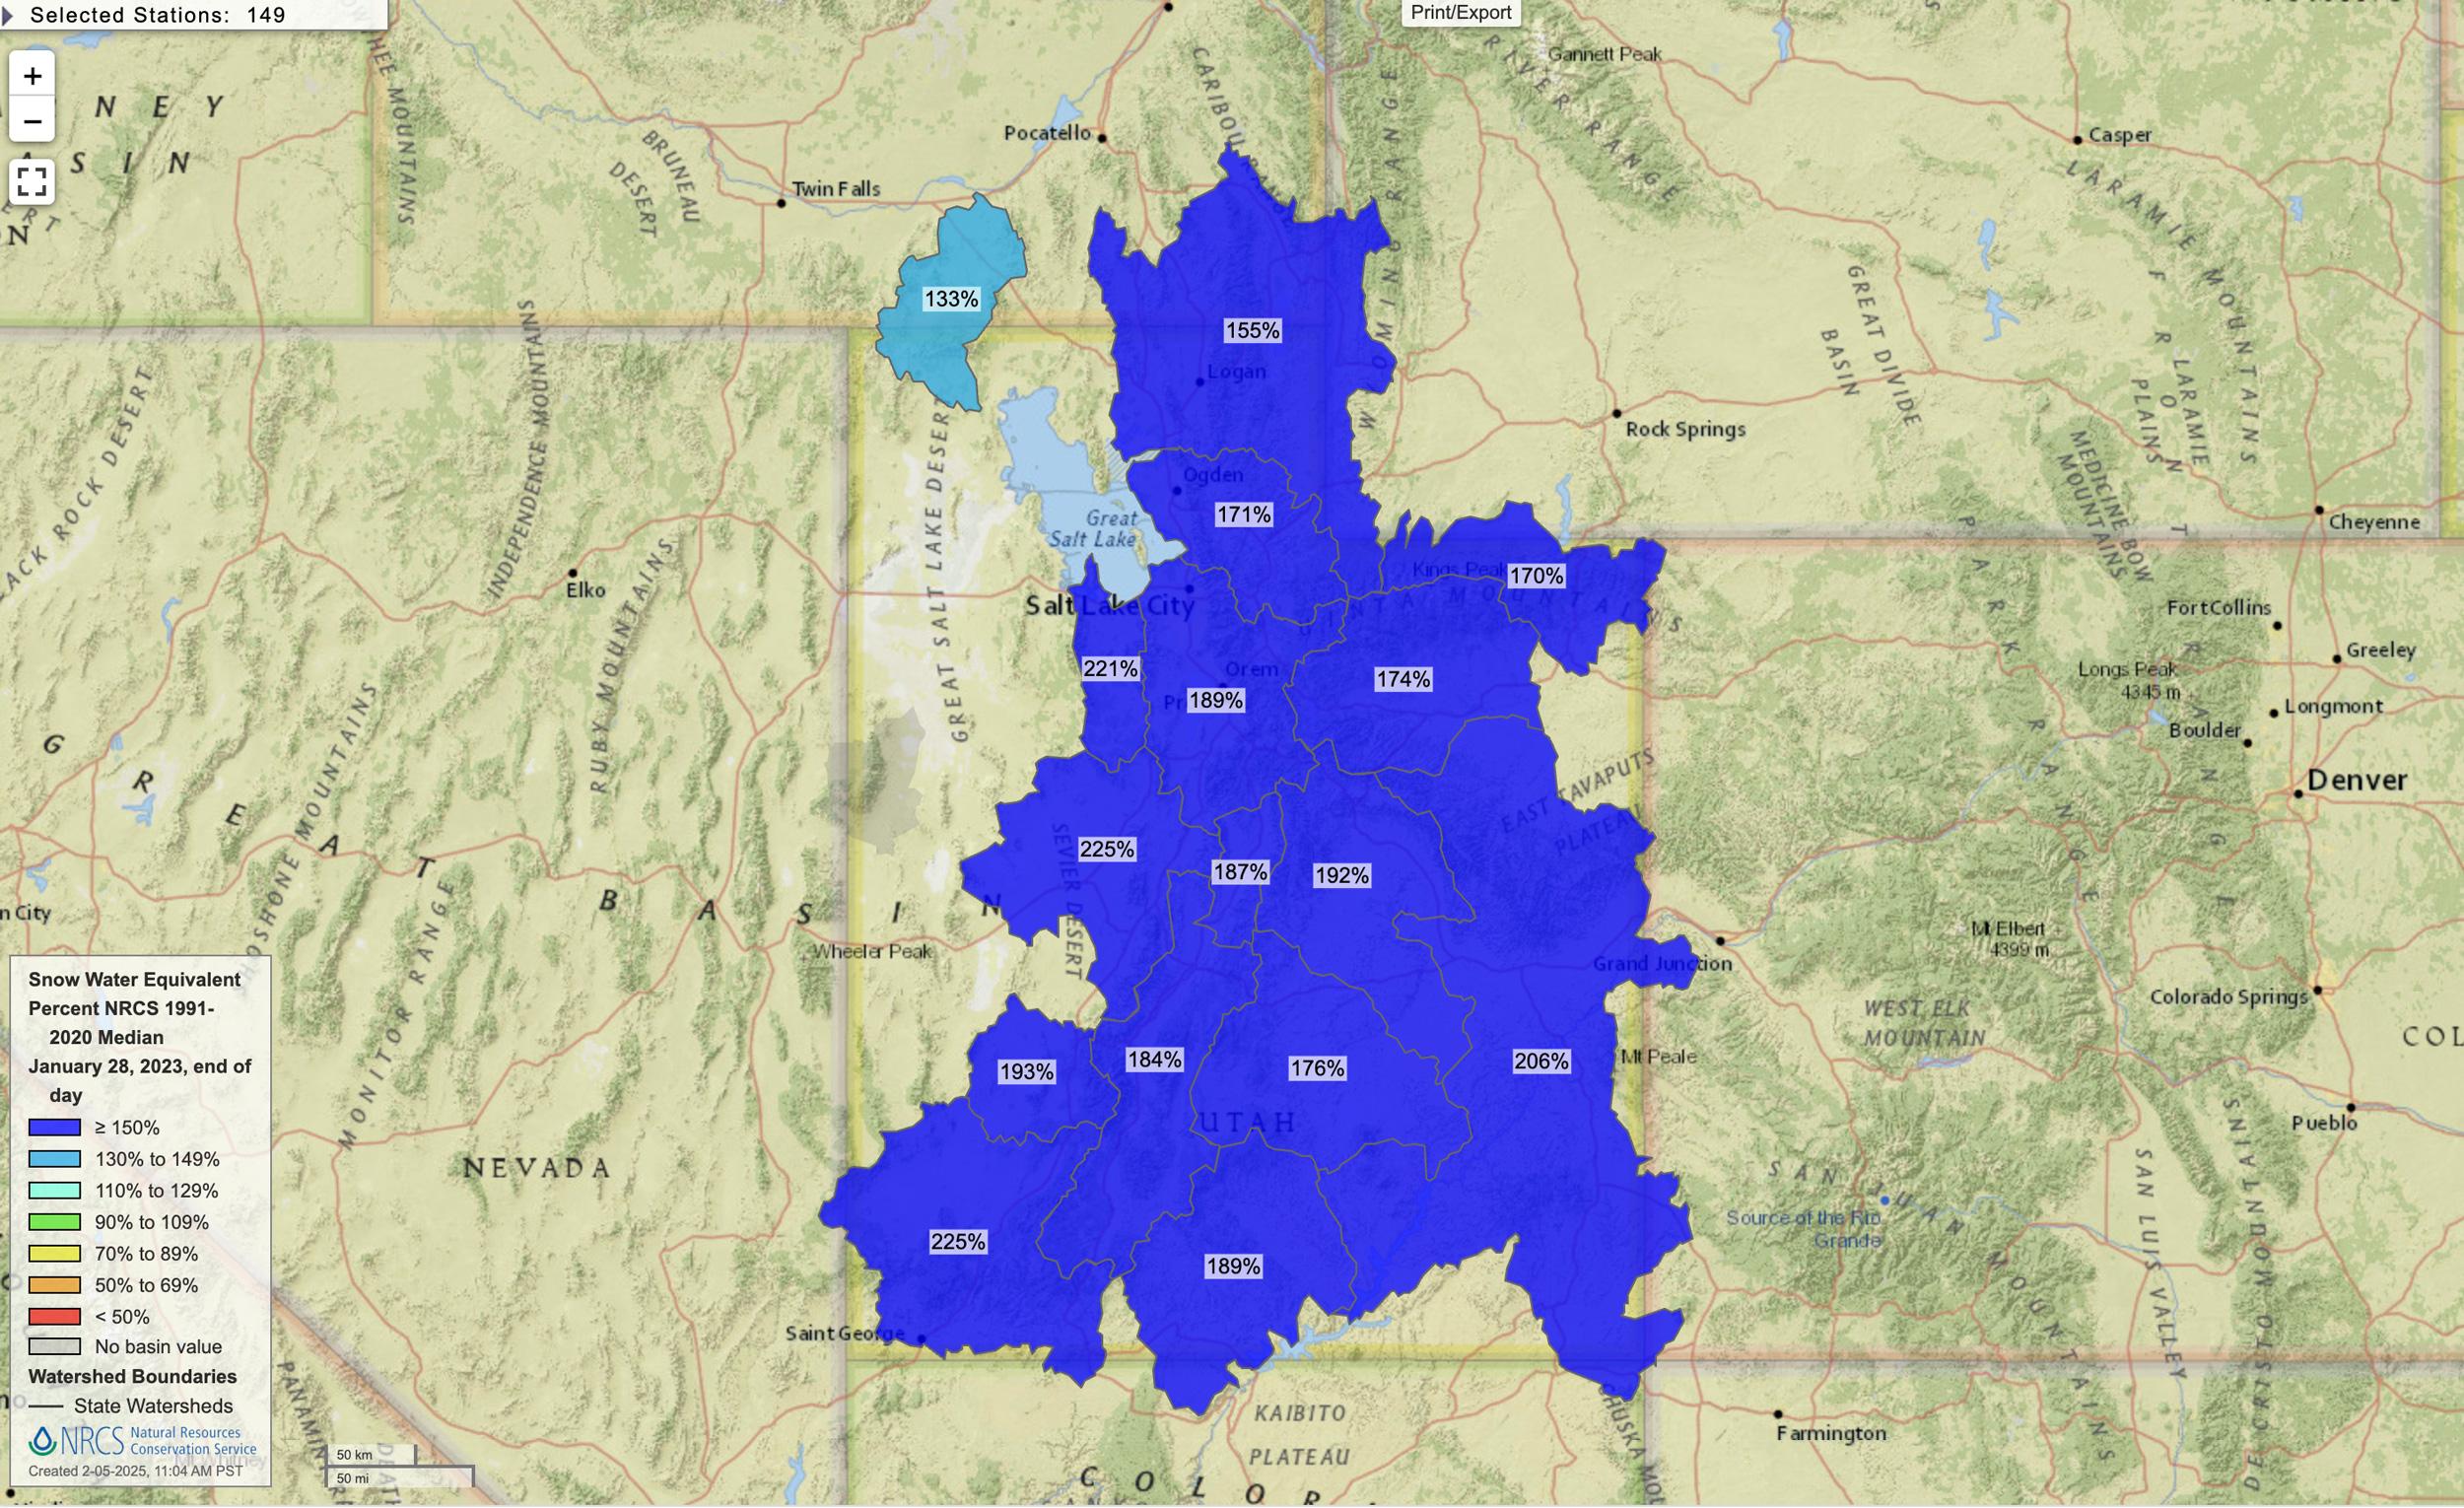
Utah January 28, 2023 snow water equivalent percent map.
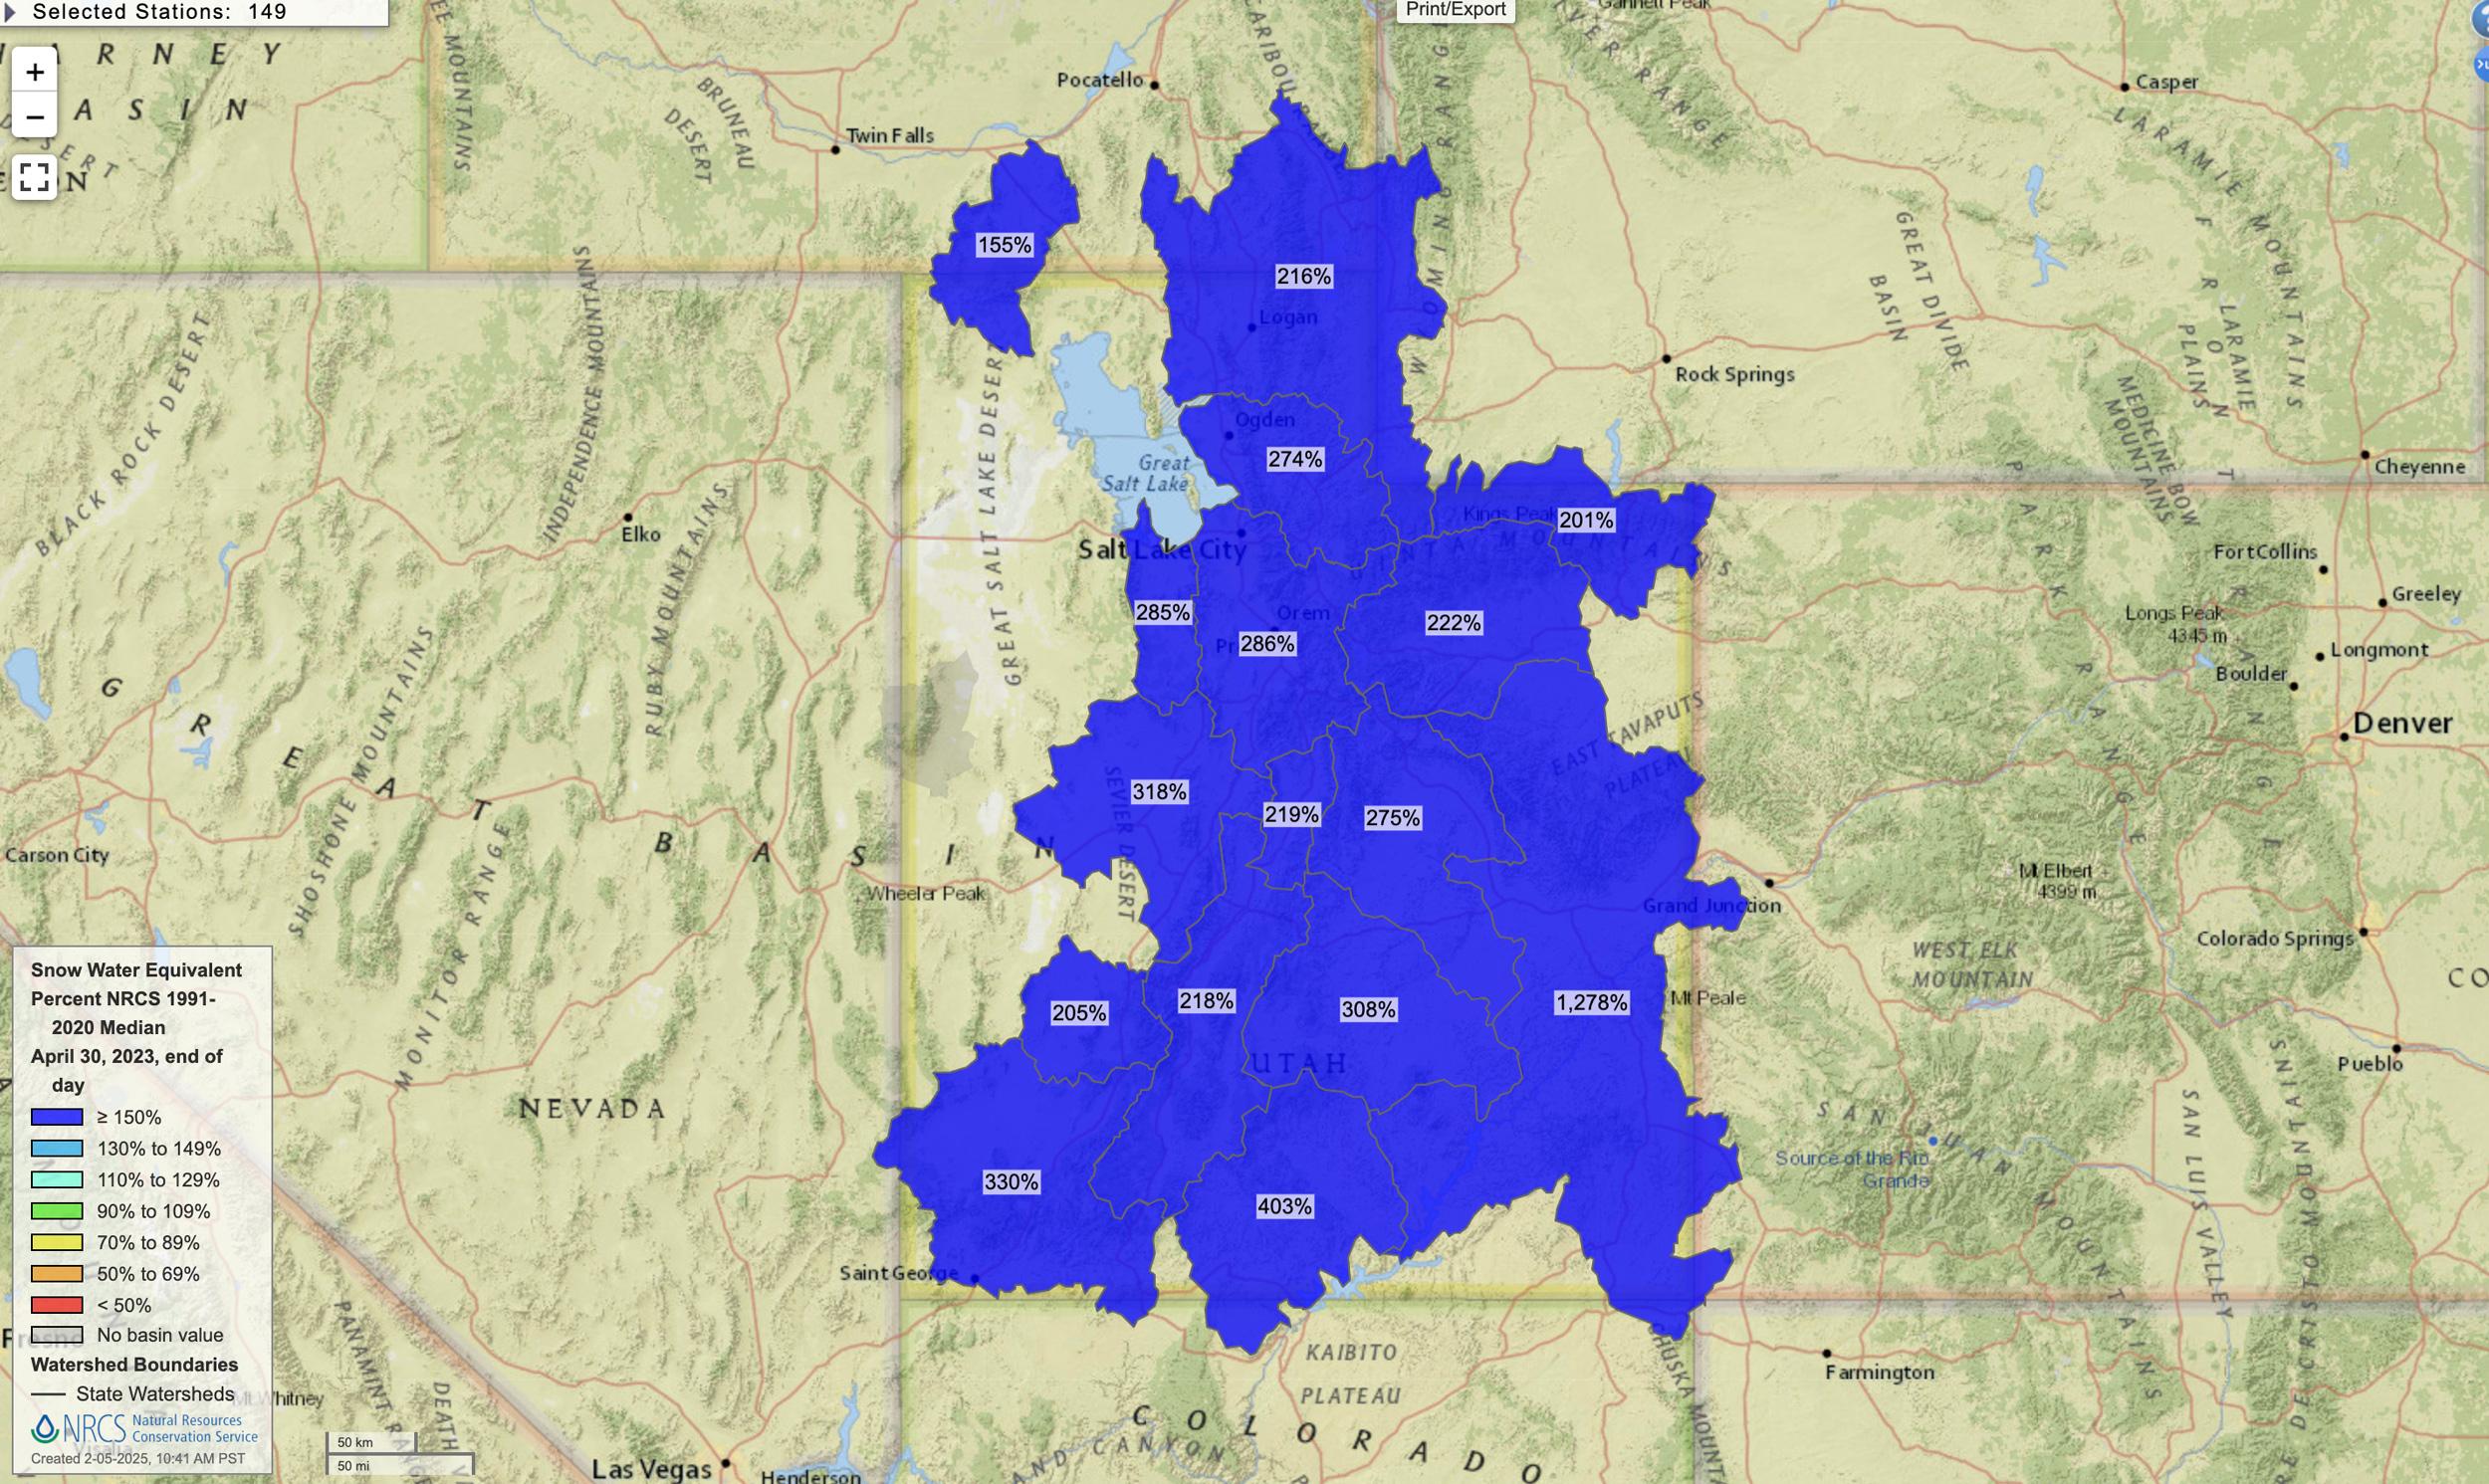
Utah April 30, 2023 snow water equivalent percent map
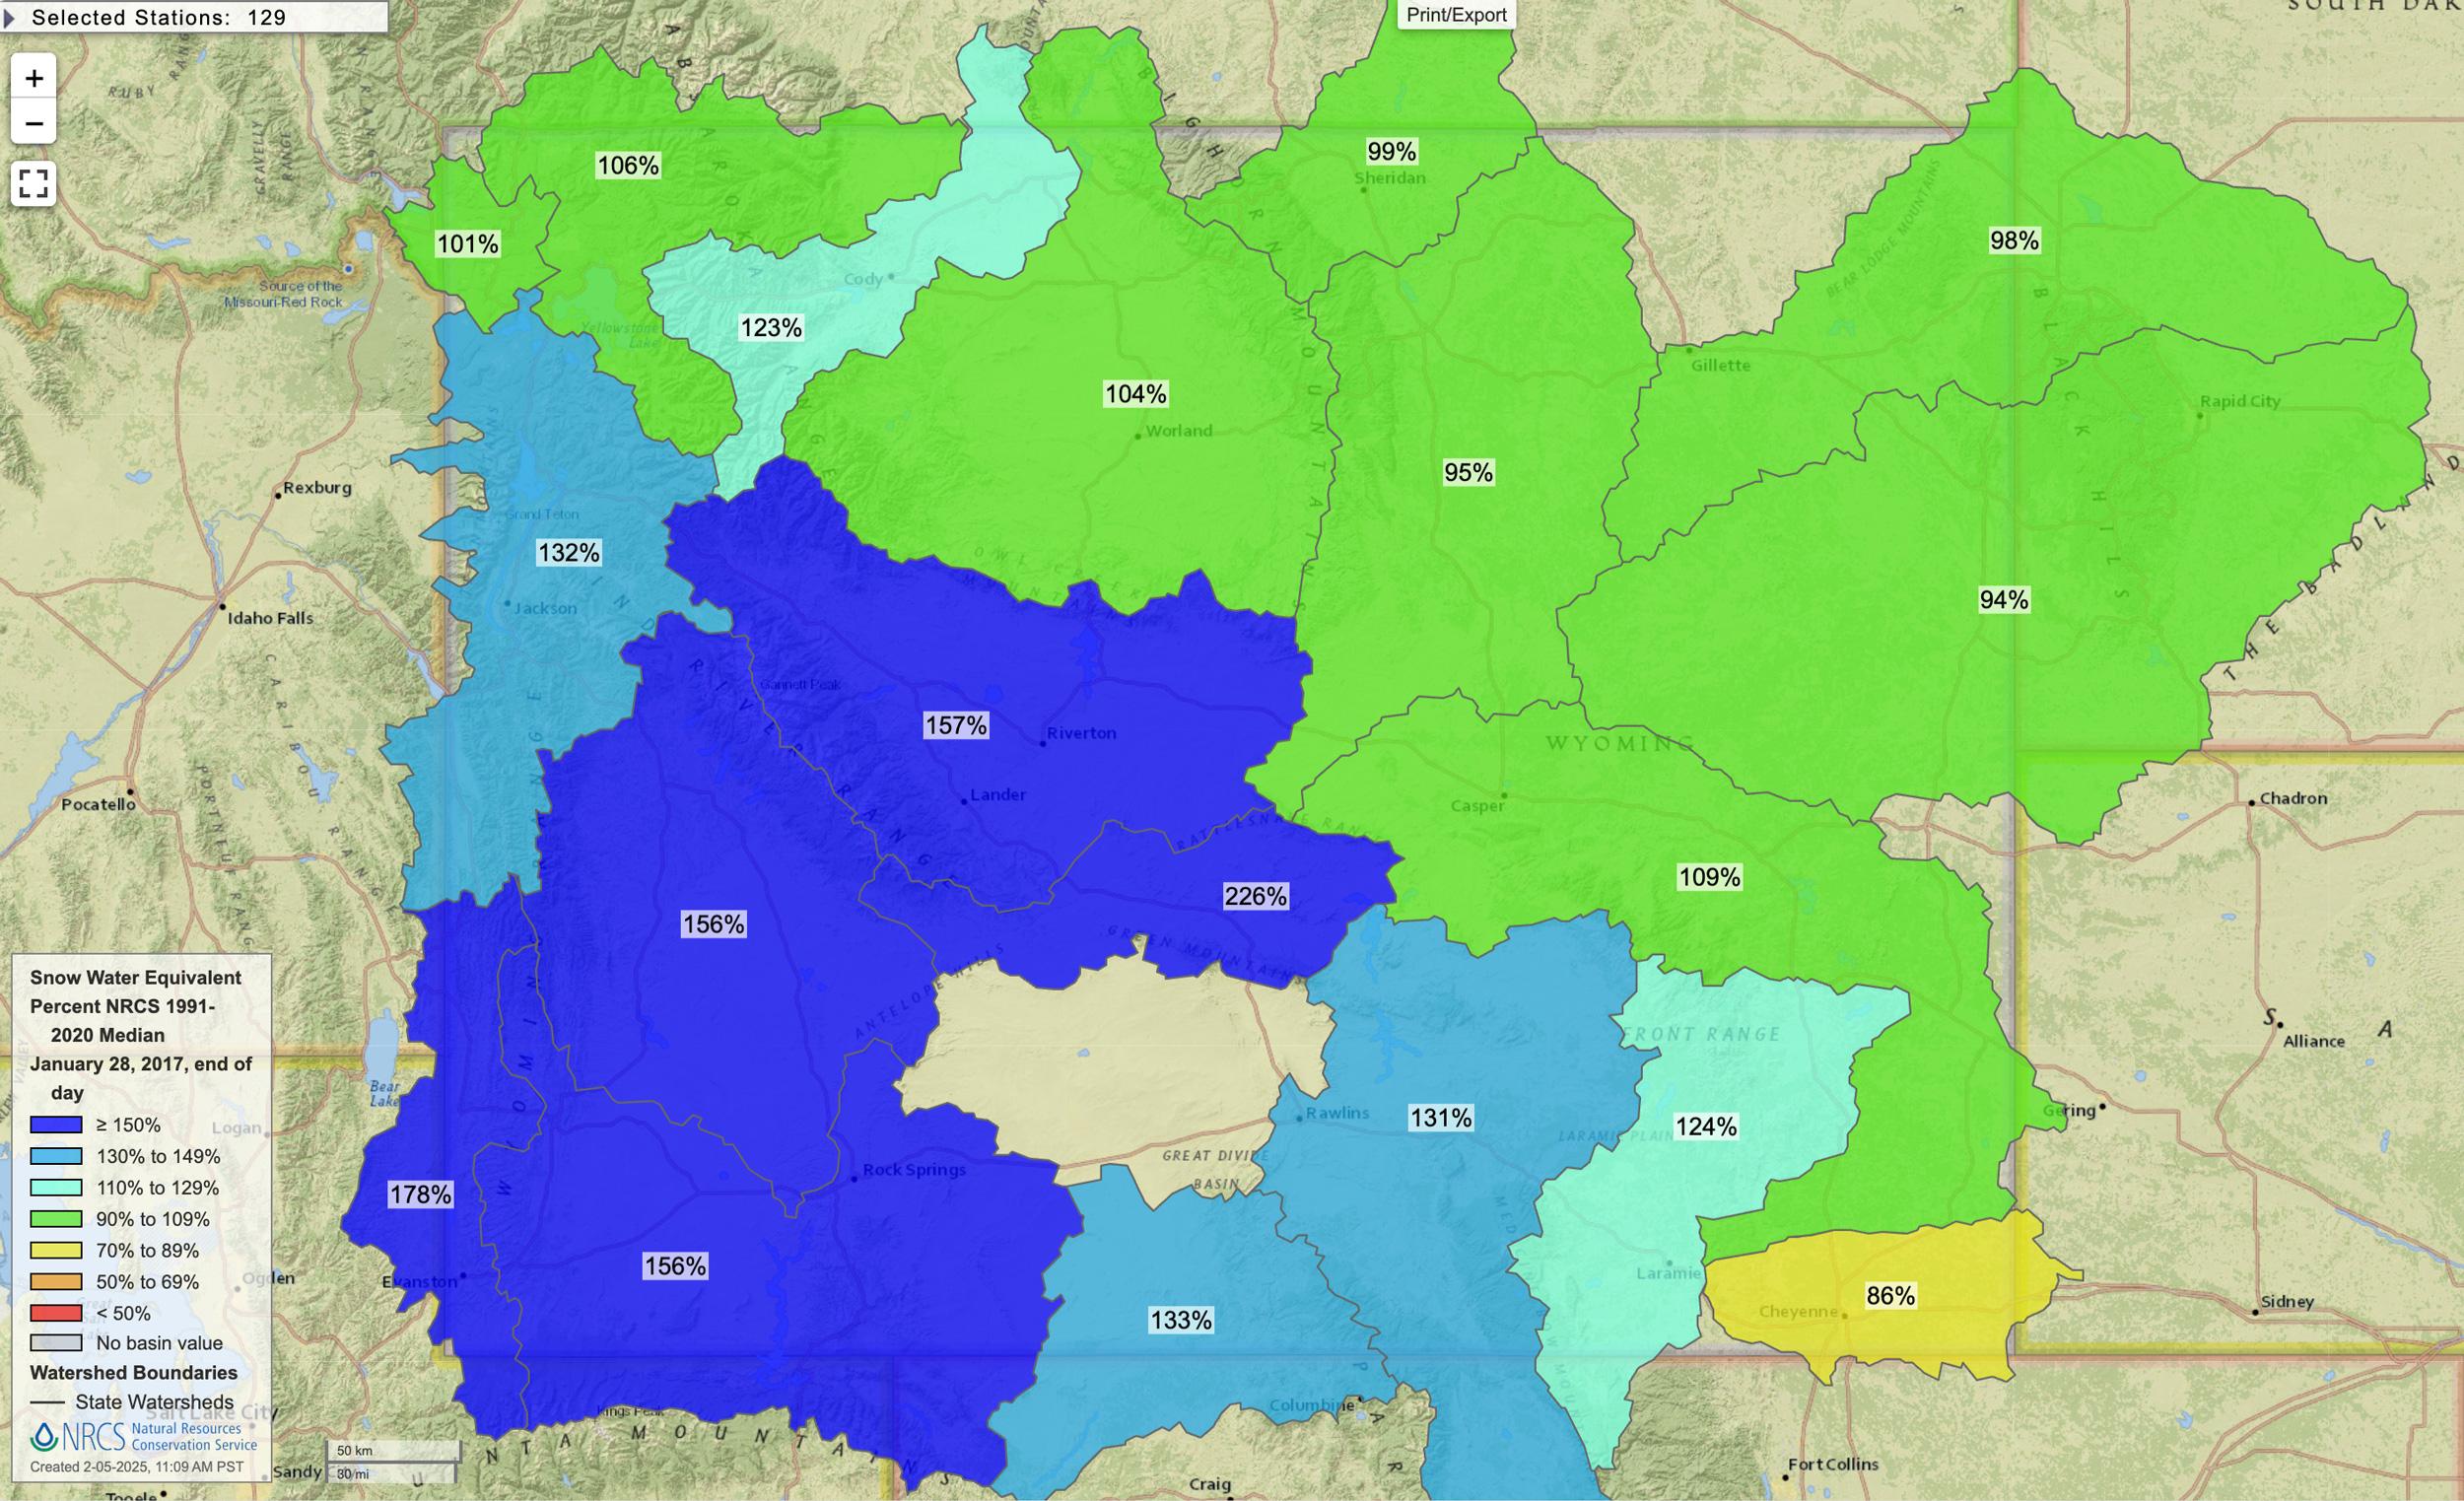
Wyoming January 28, 2017 snow water equivalent percent map.
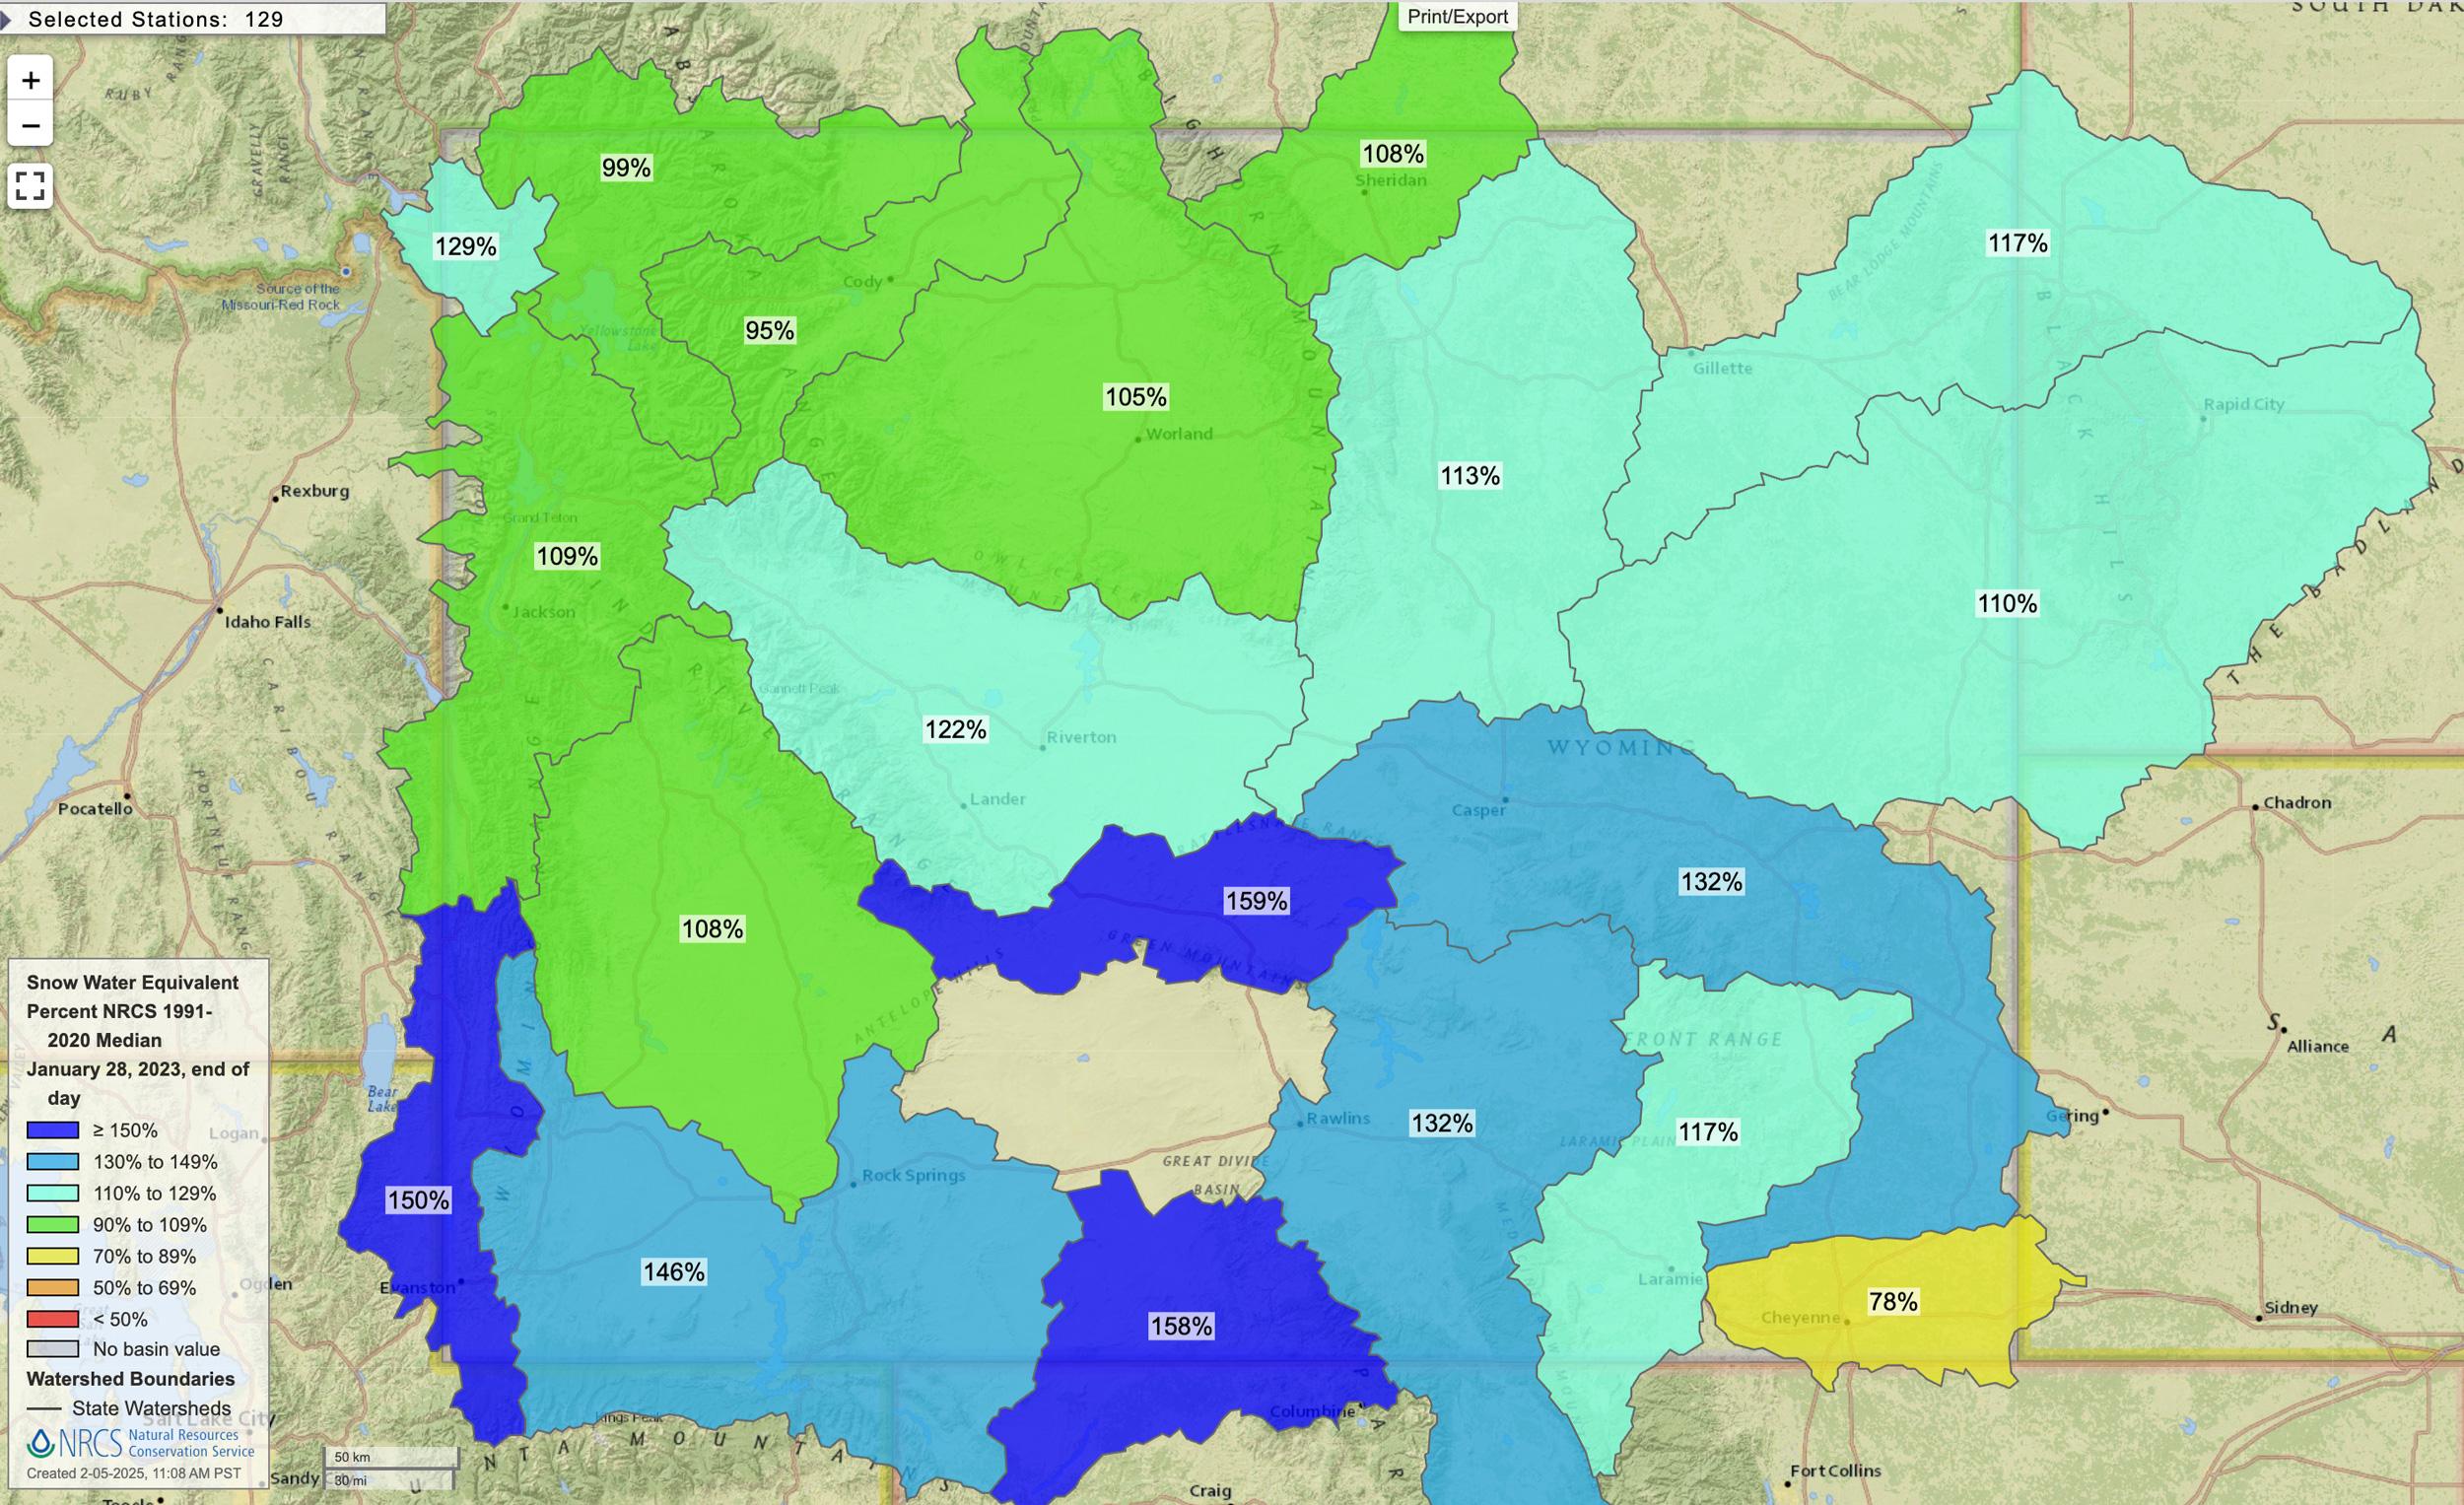
Wyoming January 28, 2023 snow water equivalent percent map.
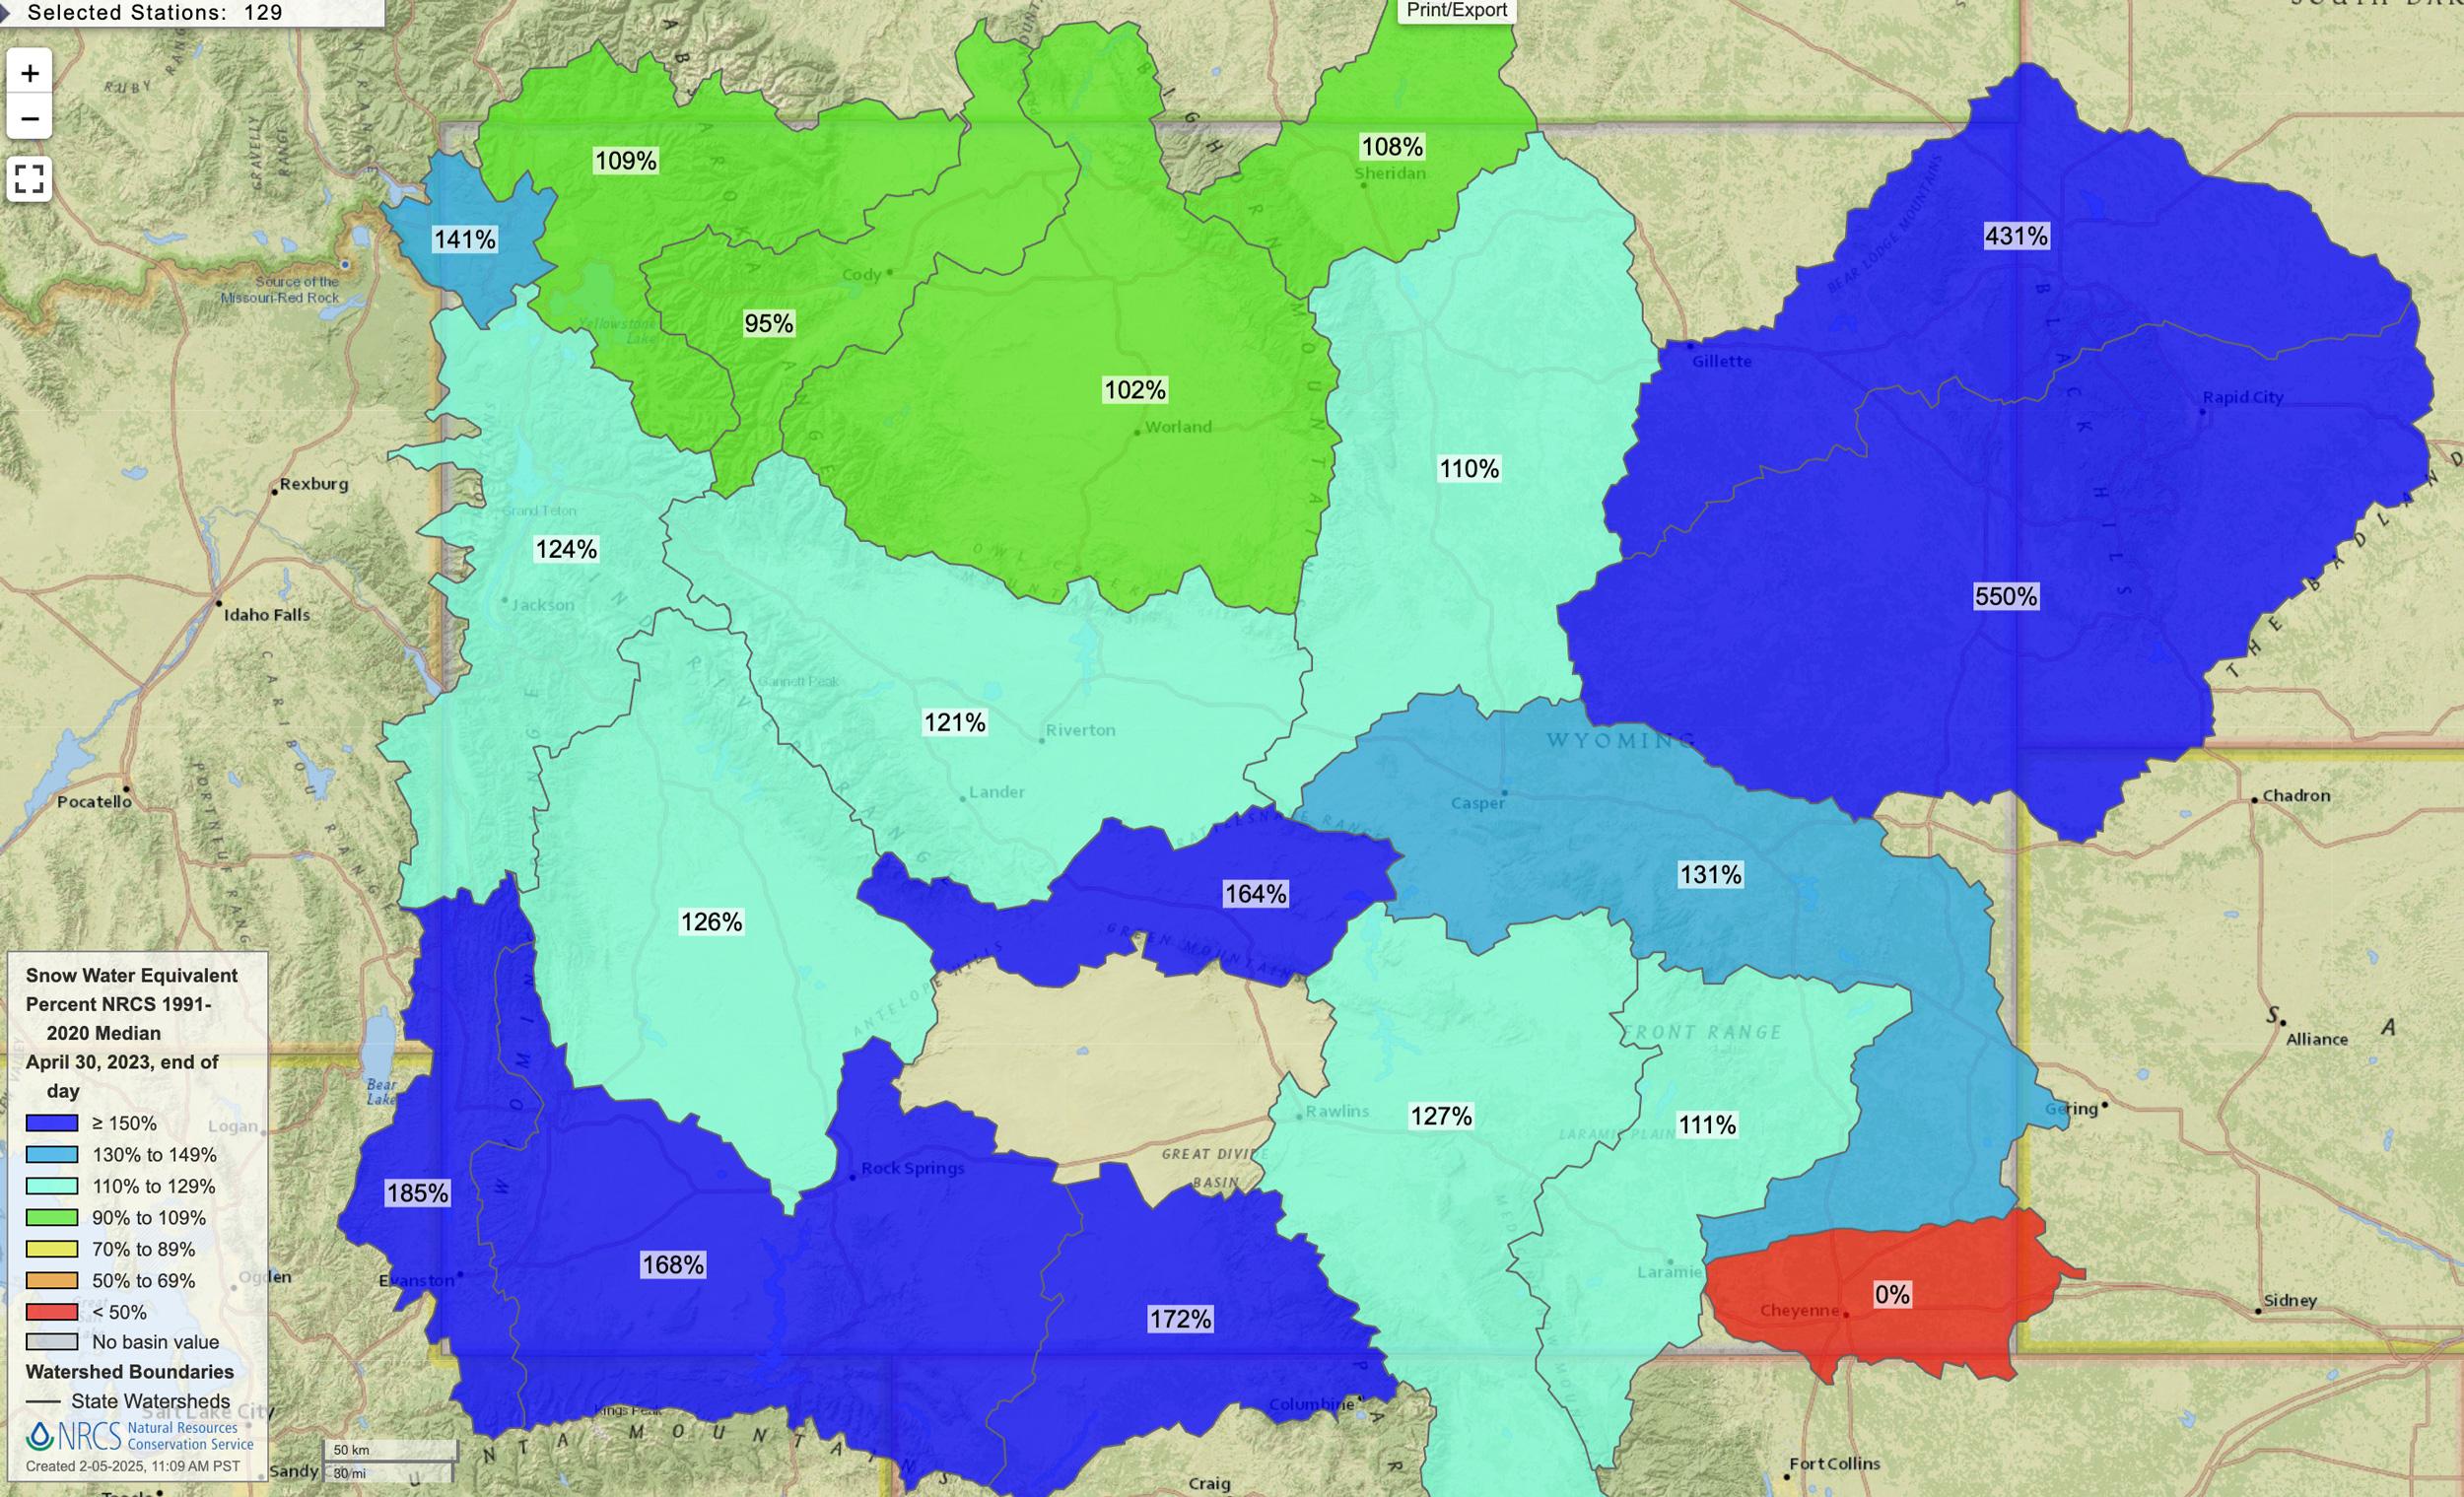
Wyoming April 30, 2023 snow water equivalent percent map.
There are lots of ways to research for your next mule deer hunt. As most know, I like to take a different approach and really analyze all the information I have in front of me before I toss my yearly hunting applications out there.
I love data, weather, and biology, so a big part of my strategy is analyzing drought and snowpack maps. If you’re a member of our Insider research platform, I’m sure you’ve seen that since day one, I’ve always included drought and snowpack maps in our state-by-state Application Strategy articles. The reason for the inclusion of those weather maps is they can be another research item in your toolkit.
During the application season, knowing the drought and snowpack of a state that you're interested in can be a very powerful approach to your research strategy. Especially when you start from an overall approach to look at trends across the West and then narrow it down to the state or basin level as you dive in. Lastly, another key area of research is looking at precipitation maps but I'll save that one for another time.
Below is a map showing the Western US snow water equivalent for early February 2025
Below is a map showing the Western US snow water equivalent for late February 2024
Below is a map showing the Western US snow water equivalent for late February 2023
For example, do you have a ton of points built up in a state for a certain species? You can potentially use weather map information like drought maps to help decide if this might be the year to burn your points if you’re chasing a dream hunt and the weather is pointing to it possibly being an excellent water year for antler growth. On the flip side, is there an extreme drought that might make animals unable to reach their full potential, and could you experience more broken bulls?
What makes these weather maps even more powerful is if there's a potential based on current trends in weather so animals could be in their best condition to be healthy and put out bigger racks based on the current conditions of the landscape. An even deeper method would be to analyze snowpack maps and drought maps to hypothetically see how doe mule deer might be fairing through the winter, spring, and summer. As really healthy does, can mean the potential that they are extra healthy and could produce fawns with great potential for that fawn to turn into a giant buck someday.
Or maybe you’re more concerned with snowpack and what that might mean for winterkill. After all, you have a lot of points saved up, and you don't want to burn them on a year that got hit hard by winter in an area you're considering hunting. While not everything you look at is cut in stone, meaning just because a state might have some drought concerns or a lot of snowpack, it doesn’t fully mean your hunt will be a bust. But it could help you narrow down a region of the state that might be fairing well before you drop a ton of points. Another consideration is how well the summer ranges faired across the west, and using both drought and snowpack maps can be used as a tool to see those conditions.
Luckily for hunters, most of the mule deer applications for states that have the potential for winterkill impacts are not until later in the year; so that alone should help when planning your hunts. While my focus is always around mule deer, these reports can also be helpful when it comes to elk on both the snowpack and drought side.
These extra research tools are another reason why I personally don’t apply for states right when the application opens. I like to take in all the data that I have in front of me and everything that we provide on our Insider-only Application Strategy Articles for each state before I apply.
For example, even though Wyoming’s deer application period opens typically around early January each year… Wyoming typically has a deadline the end of May or the first few days in June for deer. So it honestly doesn’t make sense at all to apply in January, not knowing what the winter will do or getting a chance to really soak up all the knowledge and information you have in front of you. So, while I wait to apply, I will look at drought status and snowpack levels, plus a plethora of other data points, before I toss my application to a state.
Note: when I say I don’t apply right away, this doesn’t mean I’m applying on the last day of the application deadline. I don’t want a system crash of that state’s draw to cause me to miss out on applying. When a state gets a ton of last-minute applications all at once… its websites have been known to crash. So don’t be that person. But you can apply smarter and use all the data you have available to you to then make your most informed decision on where you want to apply.
As always, I hope this helps you think outside the box when it comes to researching for your next hunt. Check out all of the hunting application deadline dates below:
In my opinion, you sort of need to use both drought status maps and snowpack/snow-depth maps in conjunction with each other to really get a feel for how each state is fairing.
Drought maps or very important for hunters. I use drought maps in many different ways: animal health, doe health to produce healthy fawns, potential moisture for spring/summer vegetation, and, of course, antler growth.
Below is a quick look at the western United States drought status map.
2025
2024
2023
Personally, I use drought maps from the U.S. Drought Monitor, but there are other sources of information as well.
It's also worth noting that we have a drought overlay on GOHUNT Maps. Once you're in GOHUNT Maps, click the "Library" button, and at the top will be a section called "Overlays." Now you select "Drought Intensity" to visually see on the map current drought conditions.
When applying for a hunt, if you're looking at states that are typically drier in nature, you can use drought maps to assess the potential for antler growth and, in a sense, animal conditions. In addition to that, I like to watch drought maps as the year progresses into the spring and summer. If the mountain range you have a tag for experiences severe drought through the summer months, there is a chance that could impact where you might find animals come hunting season. So this is something else to consider as you move from the research stage to e-scouting and finally to a week or so before your actual hunting dates.
For the most part, the drought maps that I look at determine the status of intensity based on the following categories:
The additions to those sections are definitions from the US Drought Monitor on the possible impacts of each category.
Snowpack maps are equally important when it comes to hunting research. There are lots of different forms of these maps out there. The main maps I like to look at during application season is the SNOTEL current snow water equivalent (SWE) percent of normal, the National Oceanic and Atmospheric Administration (NOAA) National Snow Analyses data set, and an even cleaner view is the US Department of Agriculture Current Snow Depth interactive map. Back in the day, you could typically access these maps in an image format, but more recently, these maps are now available on the NRCS’s website as an interactive map, and you can create custom views and save those images as needed.
First and foremost, I'm sure most people will be looking at these maps in terms of winterkill on big game. But they can also be used to assess the potential for what could come later in the year in terms of water and feed on the landscape and what that might do to an animals condition and antler growth.
On the winterkill subject, back in 2017, Dave Barnett and I worked on a great article for the 2016/2017 winterkill impacts that can be found in the link below. In-depth look at the 2017 potential winterkill
Below is a look at snow water equivalent maps for each major Western state we cover on Insider.
I have included the current 2025 data, as well as a look at the same time the previous year so you can see how each state is trending.
All images were taken on February 28 of each year except for 2025. Note: I look at these types of maps constantly, maybe at least twice a month, starting in January of each year.
It would be best to check out the USDA Snow Water Equivalent Percent Maps and adjust the dates for several different periods throughout the year to better understand how your area is doing.
You can access these maps yourself below (once you click that link, then click on the Basin Conditions map model in the upper right):
2025
2024
2023
2022
2021
2025
2024
2023
2022
2021
2025
2024
2023
2022
2021
2025
2024
2023
2022
2021
2025
2024
2023
2022
2021
2025
2024
2023
2022
2021
2025
2024
2023
2022
2021
2025
2024
2023
2022
2021
2025
2024
2023
2022
2021
2025
2024
2023
2022
2021
2025
2024
2023
2022
2025
2024
2023
2022
2021
The big question is, what if the area you want to apply for is experiencing above-average snowpack? Should there be a concern about where you apply if there is winterkill potential?
The saying that always comes to my mind is, "you can't hunt dead bucks." That saying applies to people chasing others' success in certain units, and it can definitely apply to the impact of snowpack on winterkill as well. One thing is for certain, if you do save up your points for a unit or state, there's no guarantee the range will get better before another "severe" winterkill event happens.
It's also worth mentioning that years with ample snowpack can mean that area might head into the spring and summer with great vegetation.
When states start supplemental feeding programs, it's a sign that the winter is extremely hard on animals. For instance, back in 2017, Idaho implemented a supplemental feeding program, and once again, in 2023, Idaho again opened up emergency feeding sites. And for 2023, Wyoming also has a supplemental feeding program. These feed stations happen when winters are severe on wildlife.
Note: Below is information written on the initial publish date of this article of March 1, 2023. But this information can still be used on any year you have a severe snowpack.
I know what I'm bringing up next is a very controversial subject amongst hunters, but there's no denying that winters can be extremely hard on animals, and 2023 is looking like one for the record books. I truly feel this will be a winter we might talk about for a long time.
While conditions could improve, it's hard not to think about the tole this winter might impose on mule deer. For instance, just like in 2017, Utah for 2023 has again put a shed closure in place to help out wintering wildlife. In 2017 that shed closure was until March 31 (initially, the shed closure was just for 11 counties, but later was expanded to the entire state for fear of people moving to counties that were still open). For Utah in 2023, the shed antler gathering closure goes from February 7 through April 30 on both private and public land. While people have opinions on both sides of the coin, it's hard not to understand that these restrictions are in place for the betterment of wildlife during this time of year. I only mention this part as another tool to judge the impacts that snowpack could be having on potential winterkill. When states start to supplemental feed, and place shed antler closures, that means that animals need space during this delicate time of year.
We trended toward another severe "winterkill" year in 2023, and it ended up very severe. Just as we had during that last big winter of 2017. Below is a look at the three states.
After updating this article, the answer was YES, 2023 was a severe winterkill year across several states in the west.
2017 - January 28, 2017
2023 - January 28, 2023
2023 - April 30, 2023
2017 - January 28, 2017
2023 - January 28, 2023
2023 - April 30, 2023
2017 - January 28, 2017
2023 - January 28, 2023
2023 - April 30, 2023
I also like to look at weather data (drought maps, snowpack maps and precipitation maps) to possibly see how it impacted hunts the previous year. For example, maybe you have your eye on a late-season mule deer hunt in a certain state. Did that area have the “perfect storm” in terms of weather, causing more deer to get taken? Did those weather patterns kick off the rut? I'll use these snow depth, and snow water equivalent maps to check out the mountain conditions. Back in 2017, I wrote an article titled "How to track snow conditions before your upcoming hunt." Many of the tactics I discuss in this article and that 2017 article can be used to assess the mountain before your upcoming hunt.
While looking at severe snowpack maps and even severe drought maps can force a person to feel all doom and gloom, it's not an end all be all. In regards to winterkill and snowpack/snow water equivalent maps, keep in mind that there are lots of other factors that also impact the potential for winterkill, and definitely, other means of research that can be done when trying to analyze winter's impact on wildlife or mule deer in particular. What are the impacts of a hard winter on the harvest success in the years post severe winterkill on young and mature mule deer?
Again, just like I always mention, I hope this helps you find ways to think outside the box when it comes to researching for what unit you'll apply for or even how you'll approach a hunt you drew a tag for. Knowledge is power, and using everything you have in front of you when planning your hunting applications or planning out your actual hunt is key.
This article was originally published on March 1, 2023, and has been updated with more information.
D0 = Abnormally Dry
D1 = Moderate Drought
D2 = Severe Drought
D3 = Extreme Drought
D4 = Exceptional Drought
Going into drought: short-term dryness slowing planting, growth of crops or pastures
Coming out of drought: some lingering water deficits and pastures or crops not fully recovered
Some damage to crops, pastures
Streams, reservoirs, or wells low, some water shortages developing or imminent
Voluntary water-use restrictions requested
Crop or pasture losses likely
Water shortages common
Water restrictions imposed
Major crop/pasture losses
Widespread water shortages or restrictions
Exceptional and widespread crop/pasture losses
Shortages of water in reservoirs, streams, and wells creating water emergencies