


This past year we released our research Filtering options on the GOHUNT mobile app — the same great ones that have been available on the GOHUNT website for years. These filters allow you to quickly and accurately narrow down prospective hunting opportunities based on the parameters that matter most to you: harvest success, public land percentage, draw odds, and much more!
You can use all this to find draw hunts, and even more powerful is using these research filters during the hunting season to narrow down where you should hunt when you have a general season tag that allows you to hunt multiple units.
Having a good understanding of what the specific hunt research filters are for and how they are used can be the best way to squeeze all of the juice out of Filtering on your Insider account. Below, we will take a deep dive into each of these important data points.
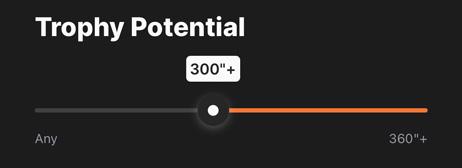
The Trophy Potential filter can give hunters an idea of the general size and potential of animals in an area, but will also allow hunters to remove less prolific units from their lists. Utilizing the filter will remove any units with a trophy potential lower than your designation. For example, I might be interested in heading to Colorado for a mule deer hunt, but I want to maximize my points and only want to come home with a buck at or above 170” Boone & Crockett (B&C). By manipulating the Trophy Potential slider, I can remove all units that are not typically known for producing deer of this caliber.
One common question we get is, “How are the trophy potentials for each unit and species calculated?” We compile these numbers through a number of avenues, including record book entries, local and external knowledge, and general trends of the units. The Trophy Potentials are not hard numbers. Rather, these should be used as a general guideline when selecting a unit. Pro tip: Depending on the type of hunt you are after, you may — or may not — use the Trophy Potential filter. Typically, I’ll use the Trophy Potential filter as one of my last ones when looking for opportunity hunts where I’m simply looking to fill a tag. However, when researching hunts that I’ve spent a few years (or more) building points for, this filter begins to carry a lot more weight. I will generally start my search without using this filter and then slowly introduce it as I narrow my results to my liking.
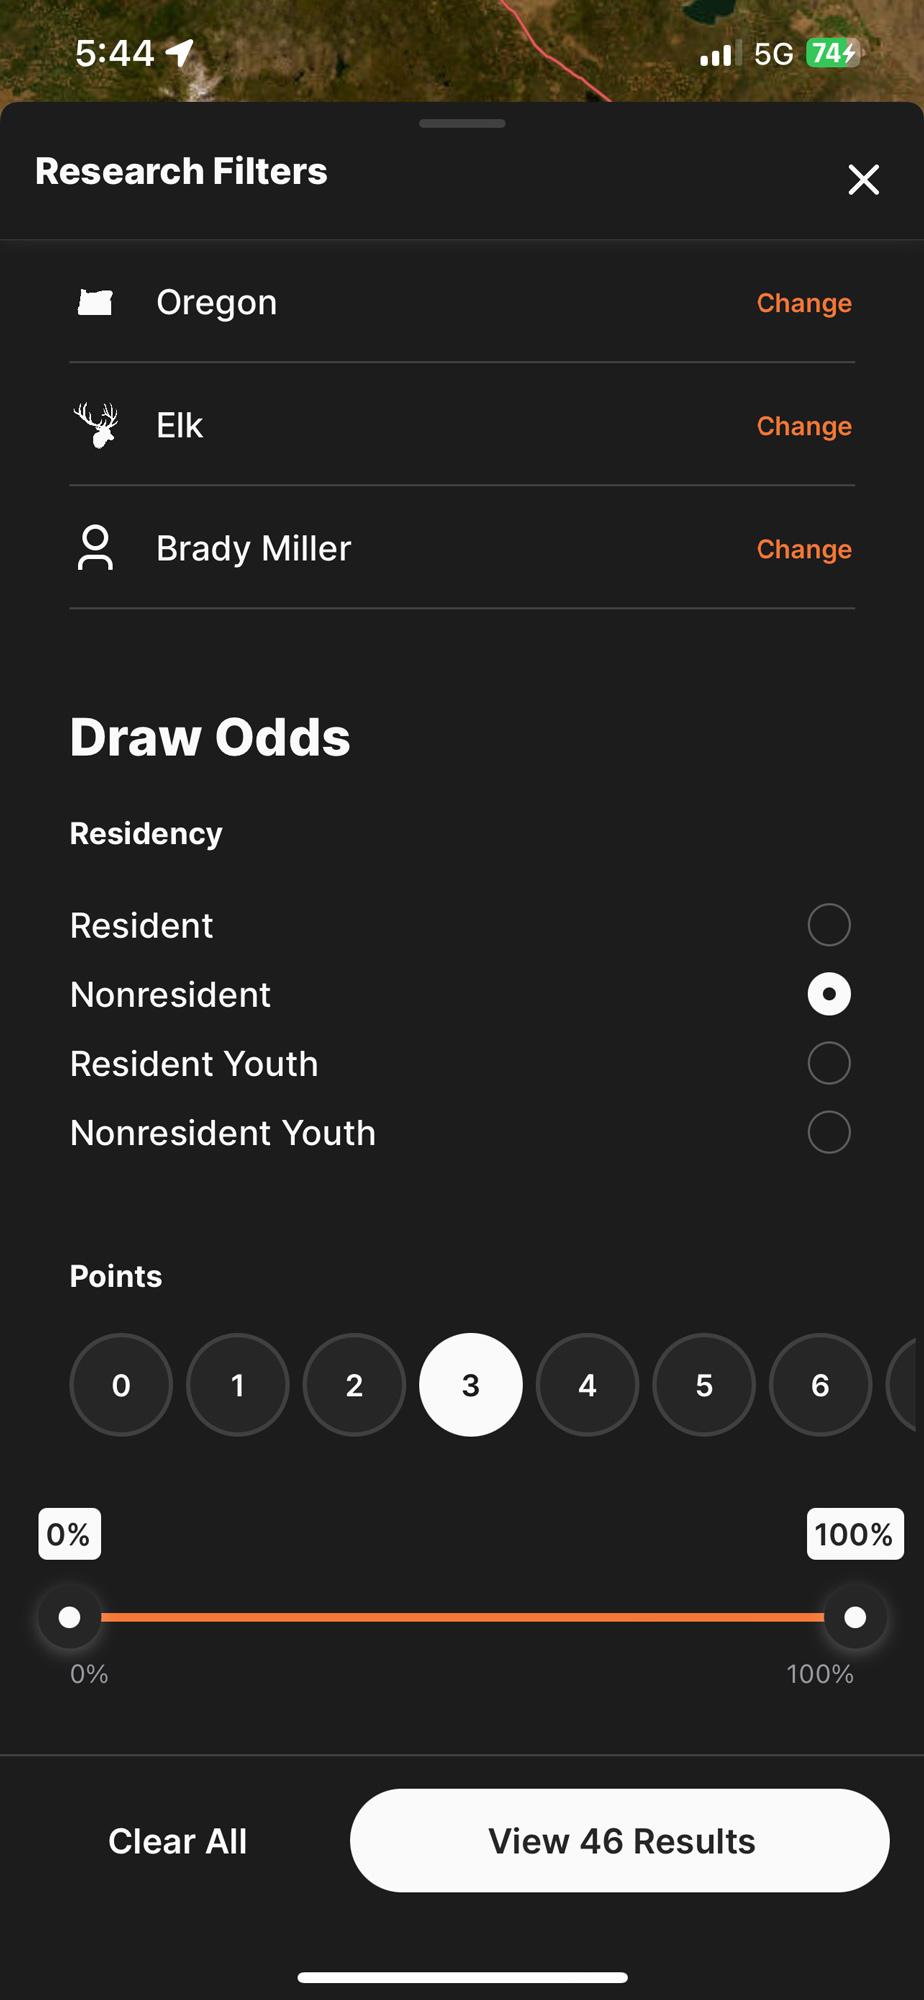
One of the most used data points on our platform are our draw odds. Draw hunts make up the vast majority of hunting opportunities in the West, and having a good handle on the draw odds for any given hunt will be crucial to the hunter. Knowing your exact odds at any given point level can mean the difference in wasting points on a tag you could have drawn several years ago or applying for hunts that you have zero chance of drawing right from the get go! Within the Draw Odds filter, you can select your residency and input your number of points (if applicable). The app will intuitively then serve you draw odds percentages based upon your residency and point level. Additionally, you can use the Draw Odds filter to further drive down your list. For example, let’s say I am researching a Montana elk permit. Montana is a state that never guarantees any tags to applicants — regardless of point level — so I know I am always dealing with random odds. Now, let's say I want to see hunts that I can apply for, but only ones with a 50% or better chance of drawing. I can use the Draw Odds filter to select hunts in the 50-100% range, and now, all hunts with draw odds below 50% will be removed from my list. Pro tip: The Draw Odds filter will only be viable for hunts that require the hunter to draw them. When researching over-the-counter (OTC) opportunities, this filter will not affect your search results. Pro tip #2: We also have youth draw odds! Be sure to change your residency to “Resident, Youth” or “Nonresident, Youth” before checking for odds.
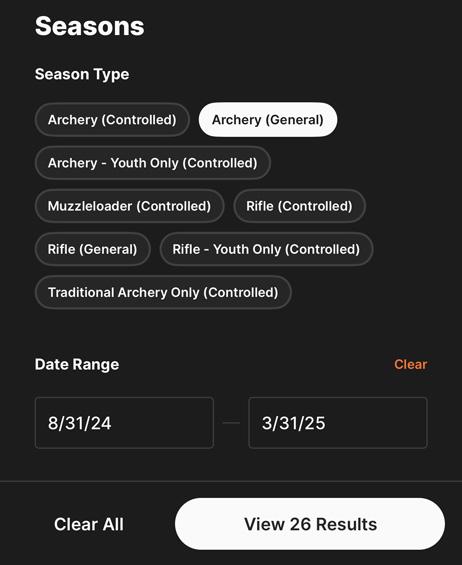
The next filter you will encounter will be the Seasons/Dates filter. This lets you quickly narrow down the list of available hunts by season type, date range — or both! This is generally one of the first filters I apply and is one I really like. For example, if I want to research archery elk hunts in Colorado, I can select those weapon types so I do not have to sift through hundreds of rifle and muzzleloader hunts. The dates section also works great if you have a definite time frame to make a hunt happen. For this, simply input the date range, and all hunts available within that range will populate. I can then use the specific season type filters to further narrow this down.
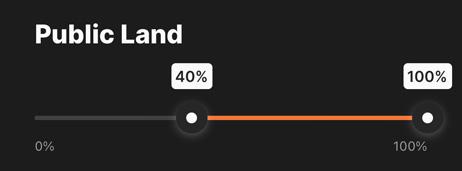
This one is fairly self-explanatory, but it is one of the best filters there is! The Public Land filter allows you to quickly narrow down units based on the amount of available public land to hunt. Adjusting this filter will quickly narrow down your hunt choices. For example, sliding the bottom end of the filter to 70% will narrow your list to only contain units with 70% or great public land percentage. Pro tip: I use this filter differently for different hunts. For example, when I am looking for a unit for an archery elk hunt, I want one with a large percentage of public land — say 75% or higher. However, if I am researching a Colorado third season rifle mule deer hunt, I know that most of the deer will be around private lands that time of the year. Because of this, I am not so much interested in the percentage of public land, but in what public land is available and where it is in proximity to private lands where I am expecting to attract deer.
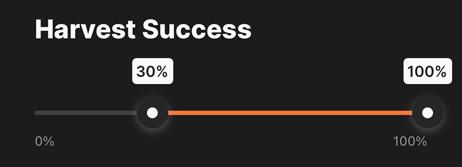
This filter is pretty straightforward. Here, you can filter by harvest success in a unit or by the number of animals harvested — whichever data point we are using for the respective state and species you are viewing. This filter can clearly give you an indication of the quality of hunting in the area as well as the type of hunting pressure you might encounter. Pro tip: I like to use this filter subjectively because the data is, well, subjective. Harvest success is merely an indication of hunter effort. I would encourage anyone reading this to consider why the numbers may be how they are. A low success rate can indicate low animal populations, but it can also indicate that the area is just tough to hunt. Conversely, a high success rate can indicate good populations, but could also be skewed in a unit with a lot of private land and private land hunters. Sometimes, the harvest success of a unit is not directly linked to the quality of hunting present.
This article was originally published on January 25, 2024, and has been updated with more information.