All the latest and greatest information that you need to know about when applying for elk in Wyoming for the 2026 hunting season. Dive in and start your research today

Item | Nonresident application fee |
|---|---|
Cost | $15 |
Item | Resident application fee |
Cost | $5 |
Item | Nonresident regular full priced elk |
Cost | $707 |
Item | Nonresident special full priced elk |
Cost | $1,965 |
Item | Nonresident youth full priced elk |
Cost | $290 |
Item | Nonresident reduced price elk |
Cost | $303 |
Item | Nonresident youth reduced price elk |
Cost | $115 |
Item | Resident full priced elk |
Cost | $62 |
Item | Resident youth full priced elk |
Cost | $30 |
Item | Resident reduced price elk |
Cost | $48 |
Item | Resident youth reduced price elk |
Cost | $25 |
Item | Cost |
|---|---|
Nonresident application fee | $15 |
Resident application fee | $5 |
Nonresident regular full priced elk | $707 |
Nonresident special full priced elk | $1,965 |
Nonresident youth full priced elk | $290 |
Nonresident reduced price elk | $303 |
Nonresident youth reduced price elk | $115 |
Resident full priced elk | $62 |
Resident youth full priced elk | $30 |
Resident reduced price elk | $48 |
Resident youth reduced price elk | $25 |
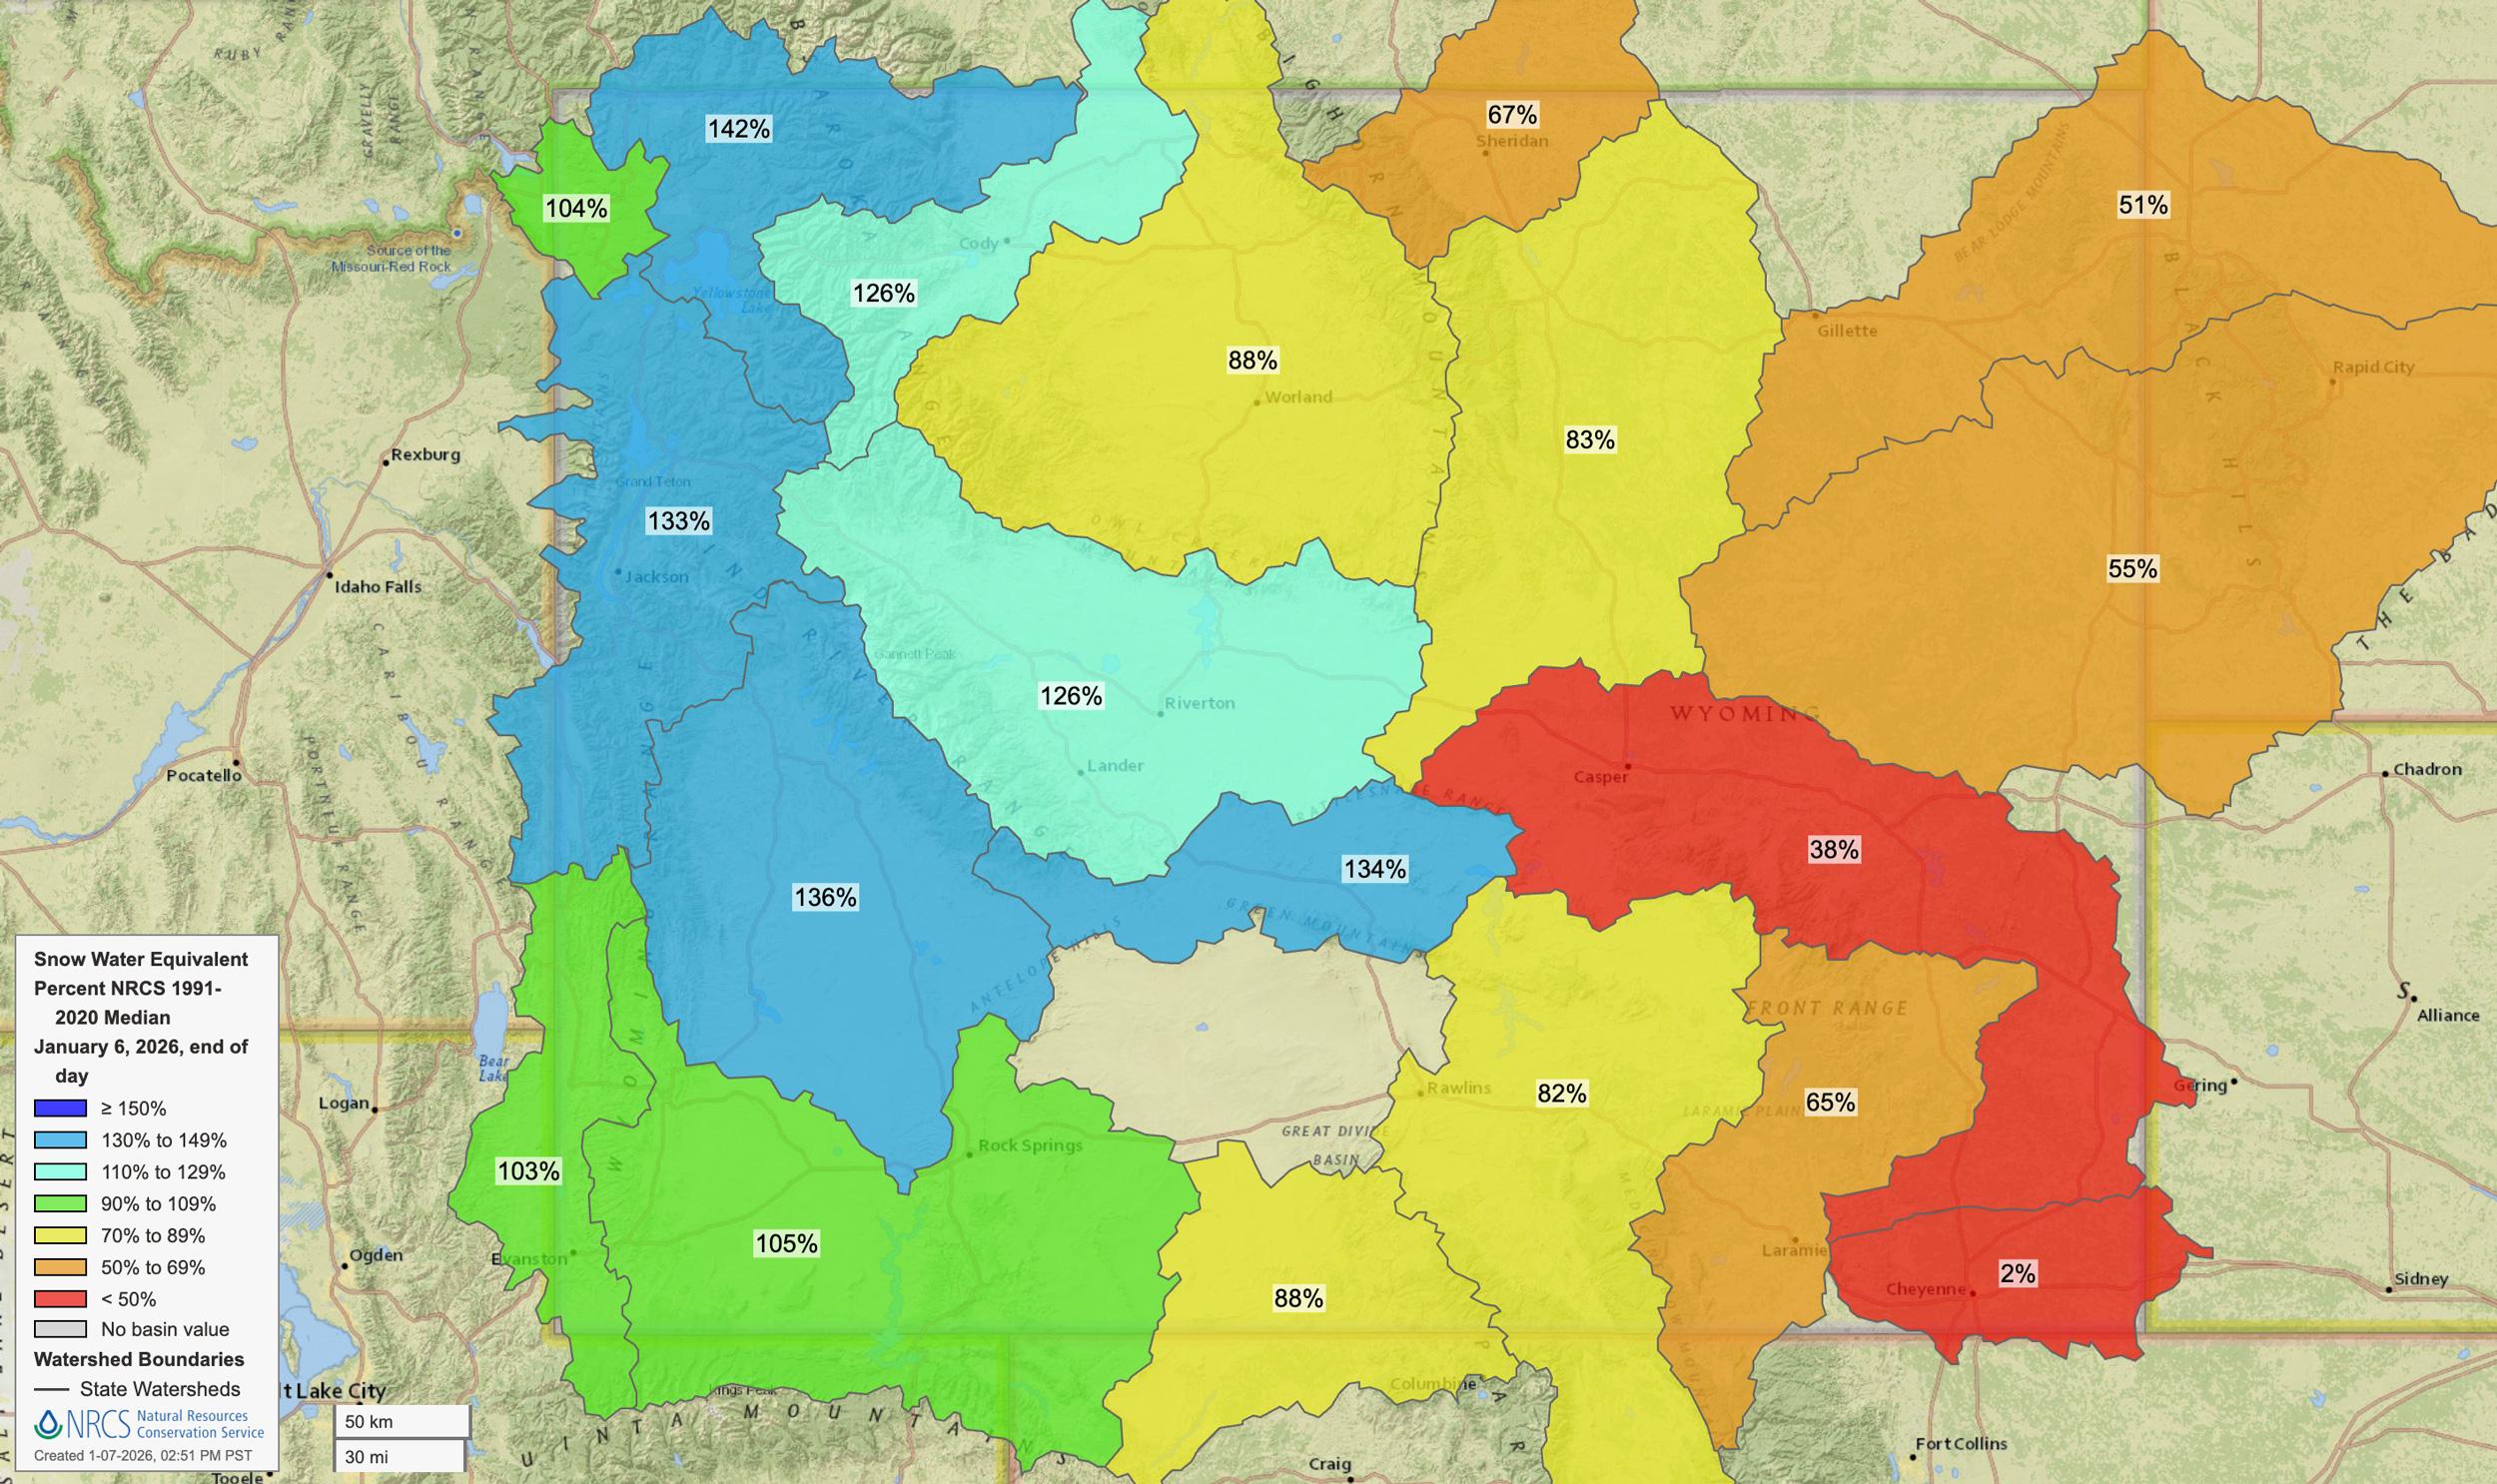
January 6, 2026, Wyoming snow water equivalent percent of normal.
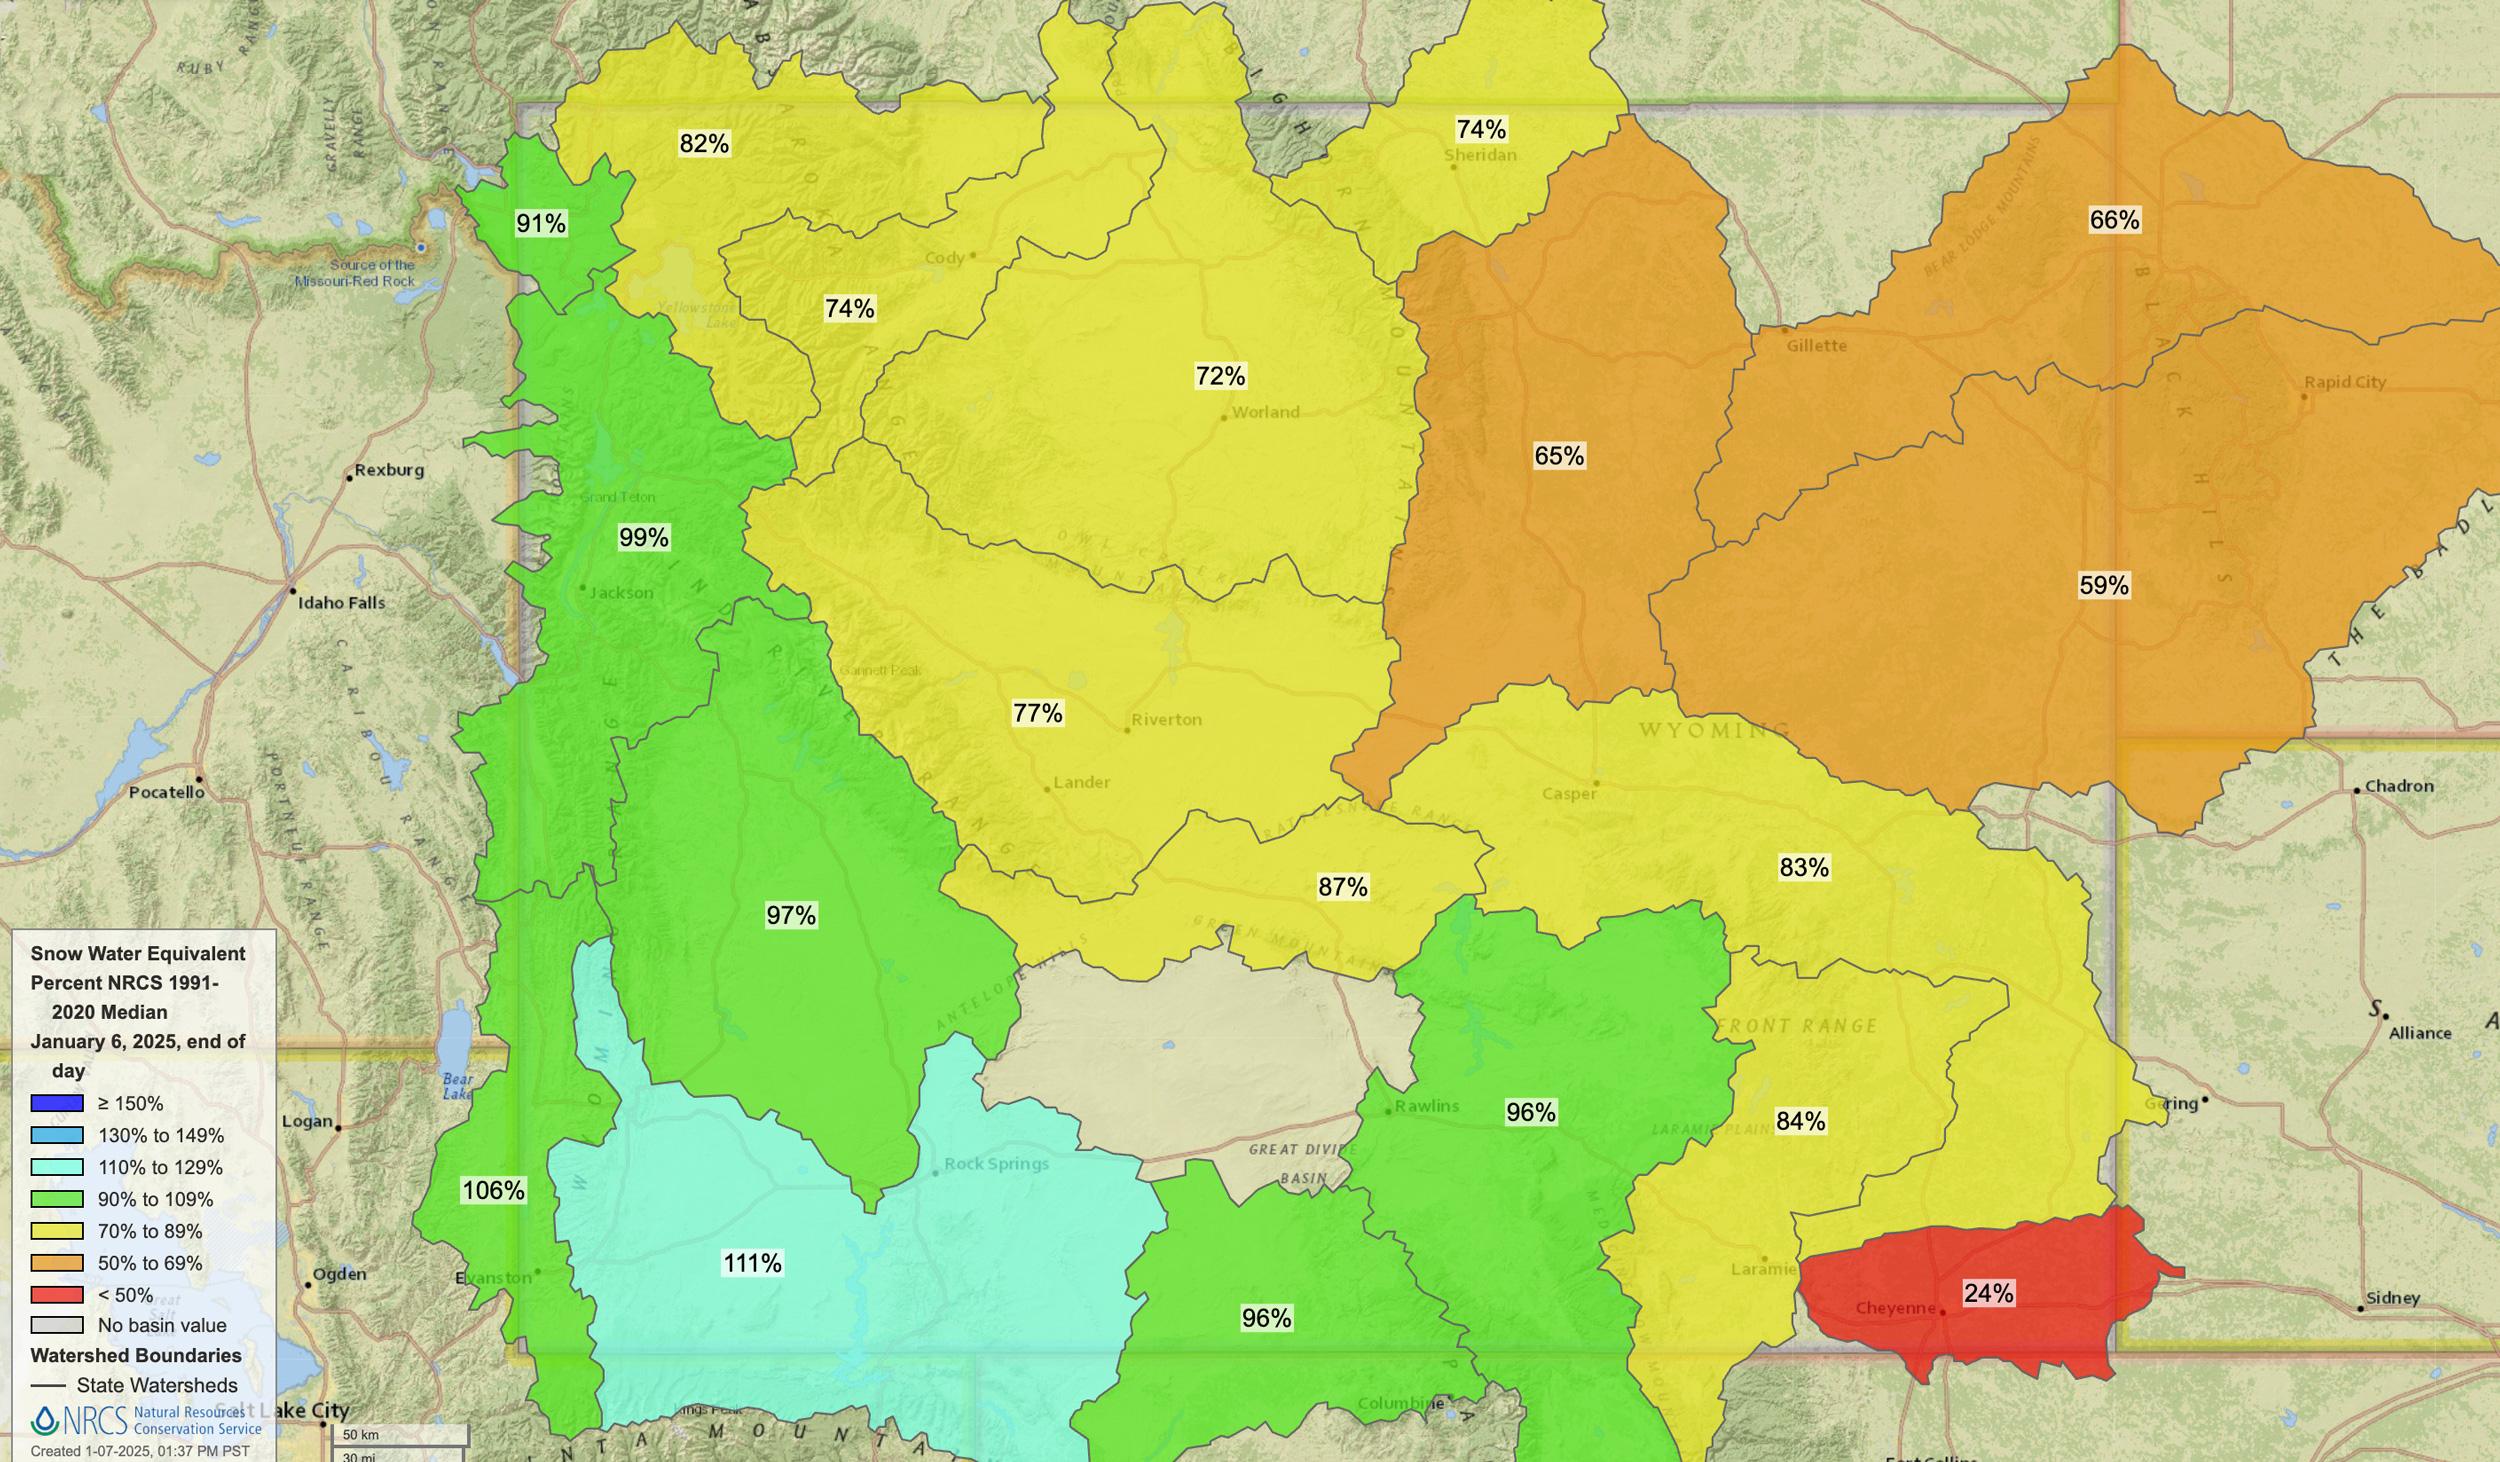
January 6, 2025, Wyoming snow water equivalent percent of normal.
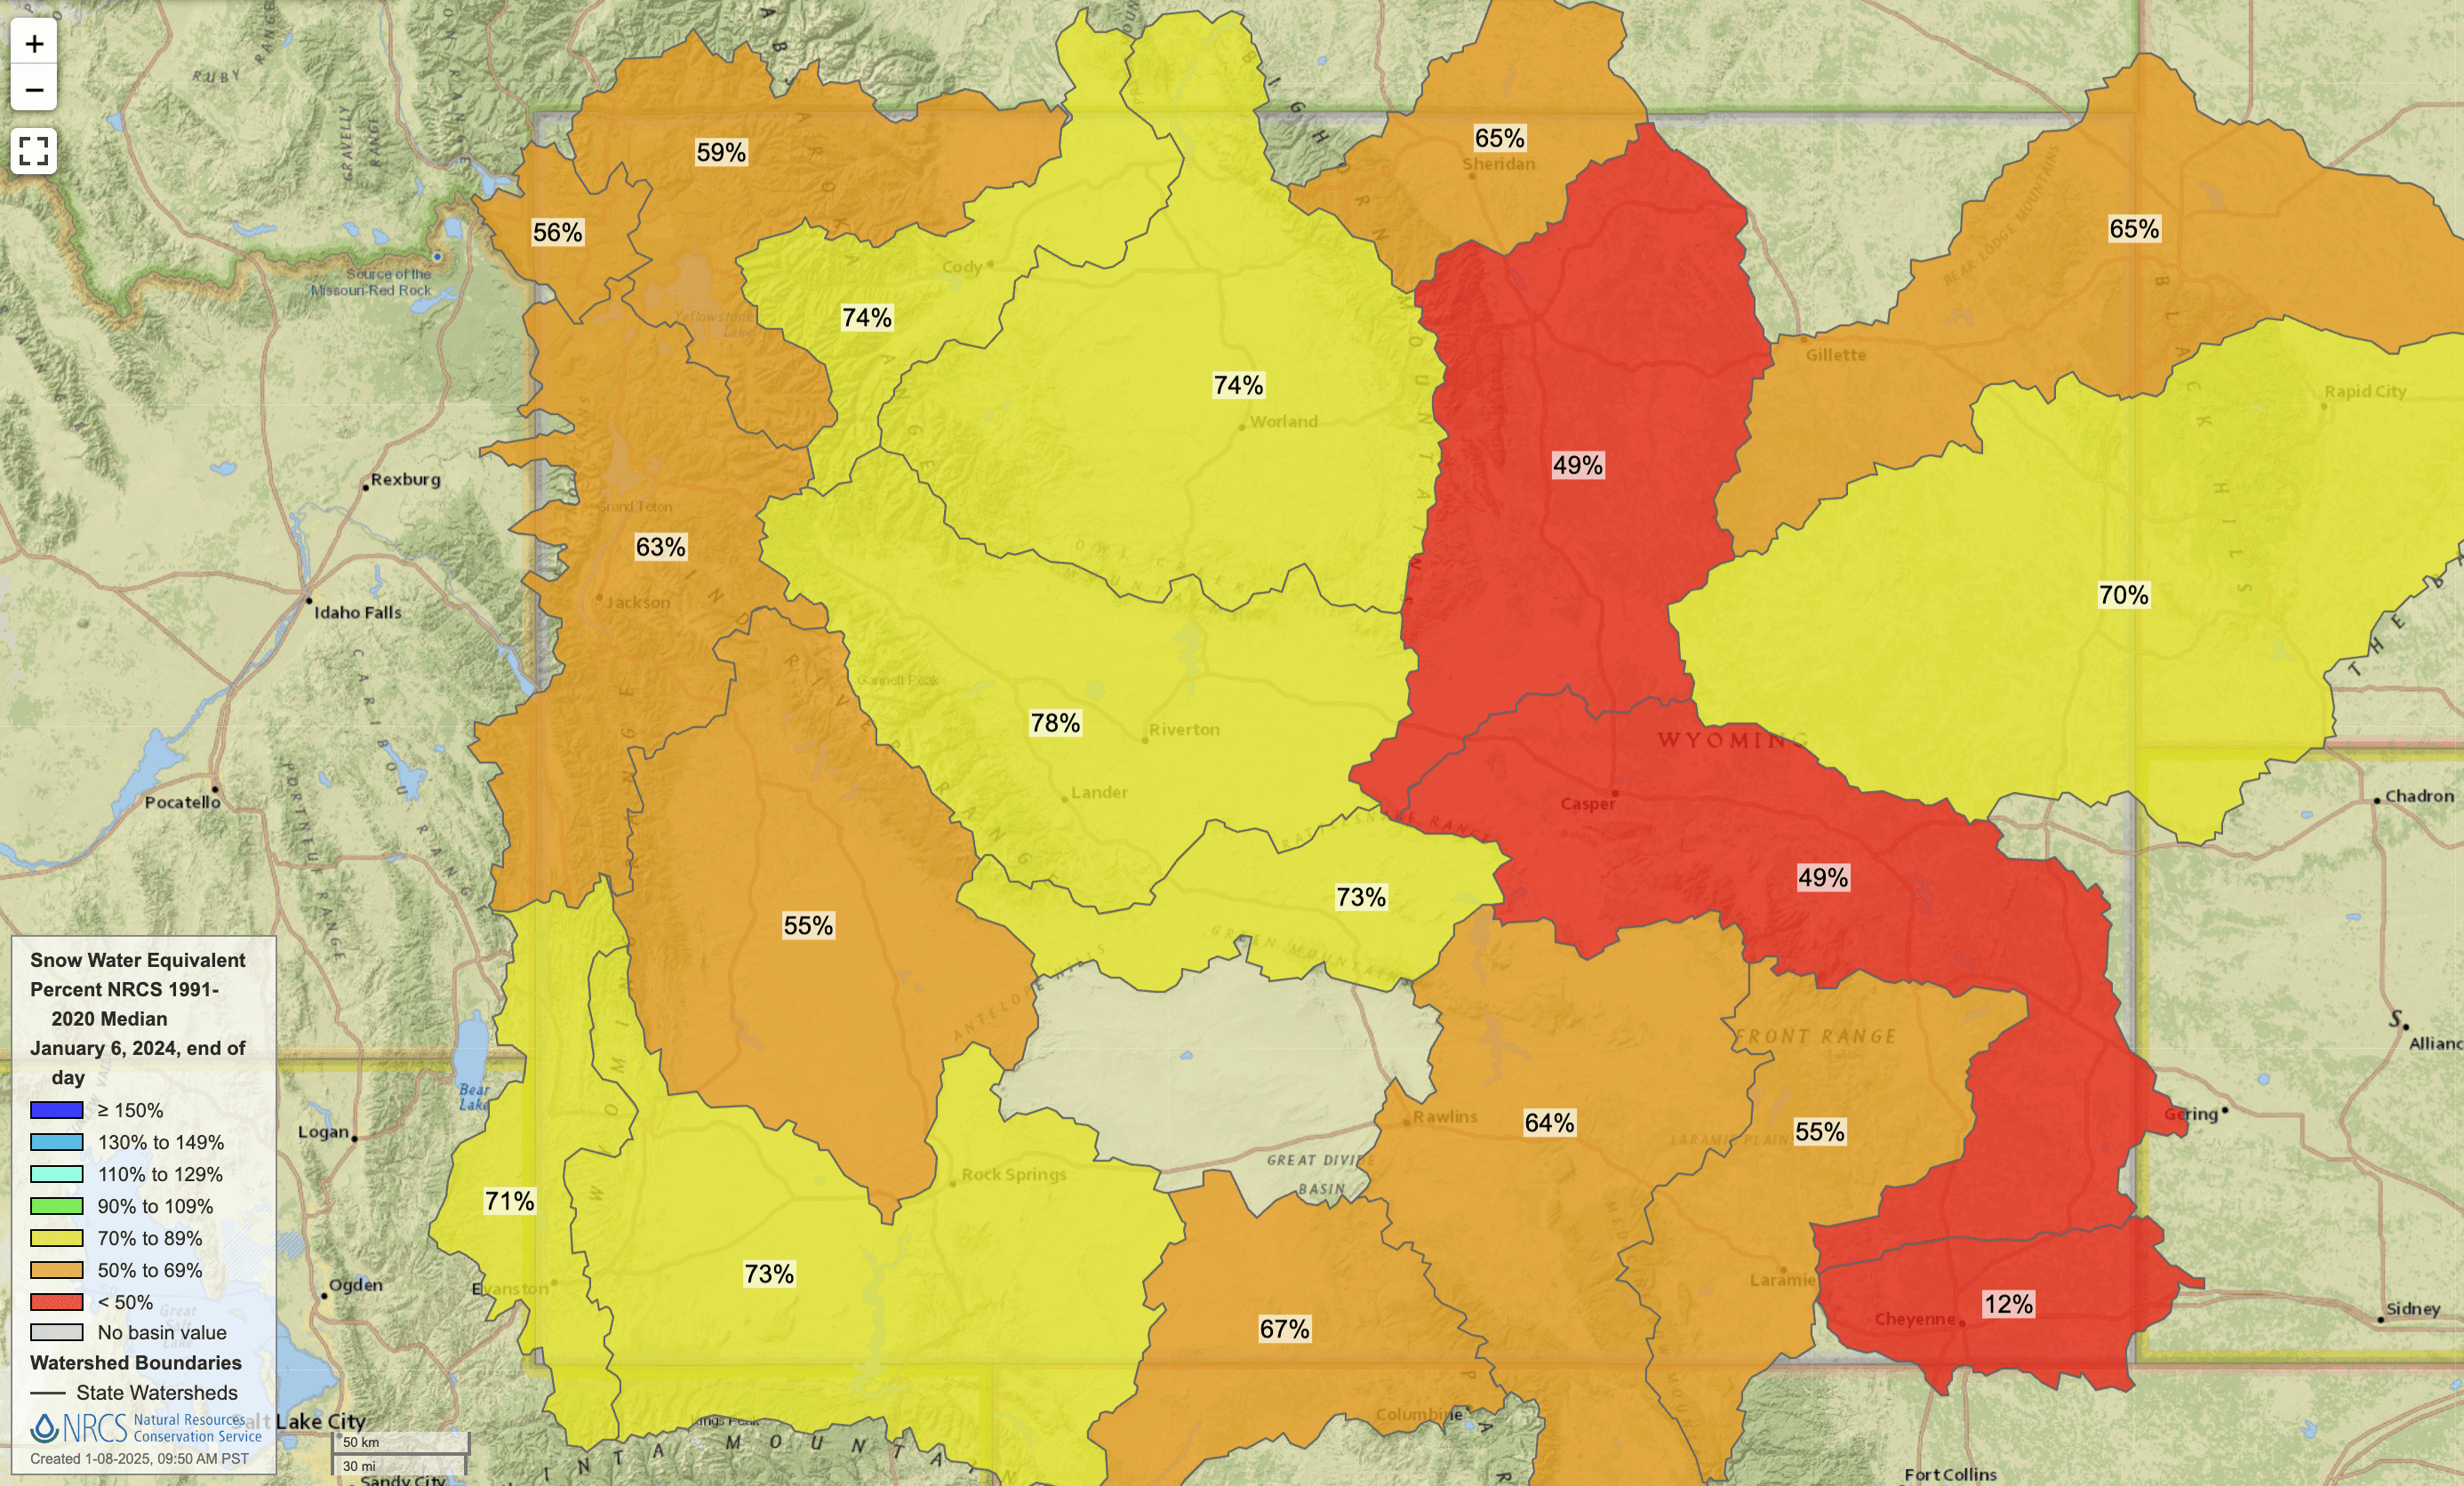
January 6, 2024, Wyoming snow water equivalent percent of normal.
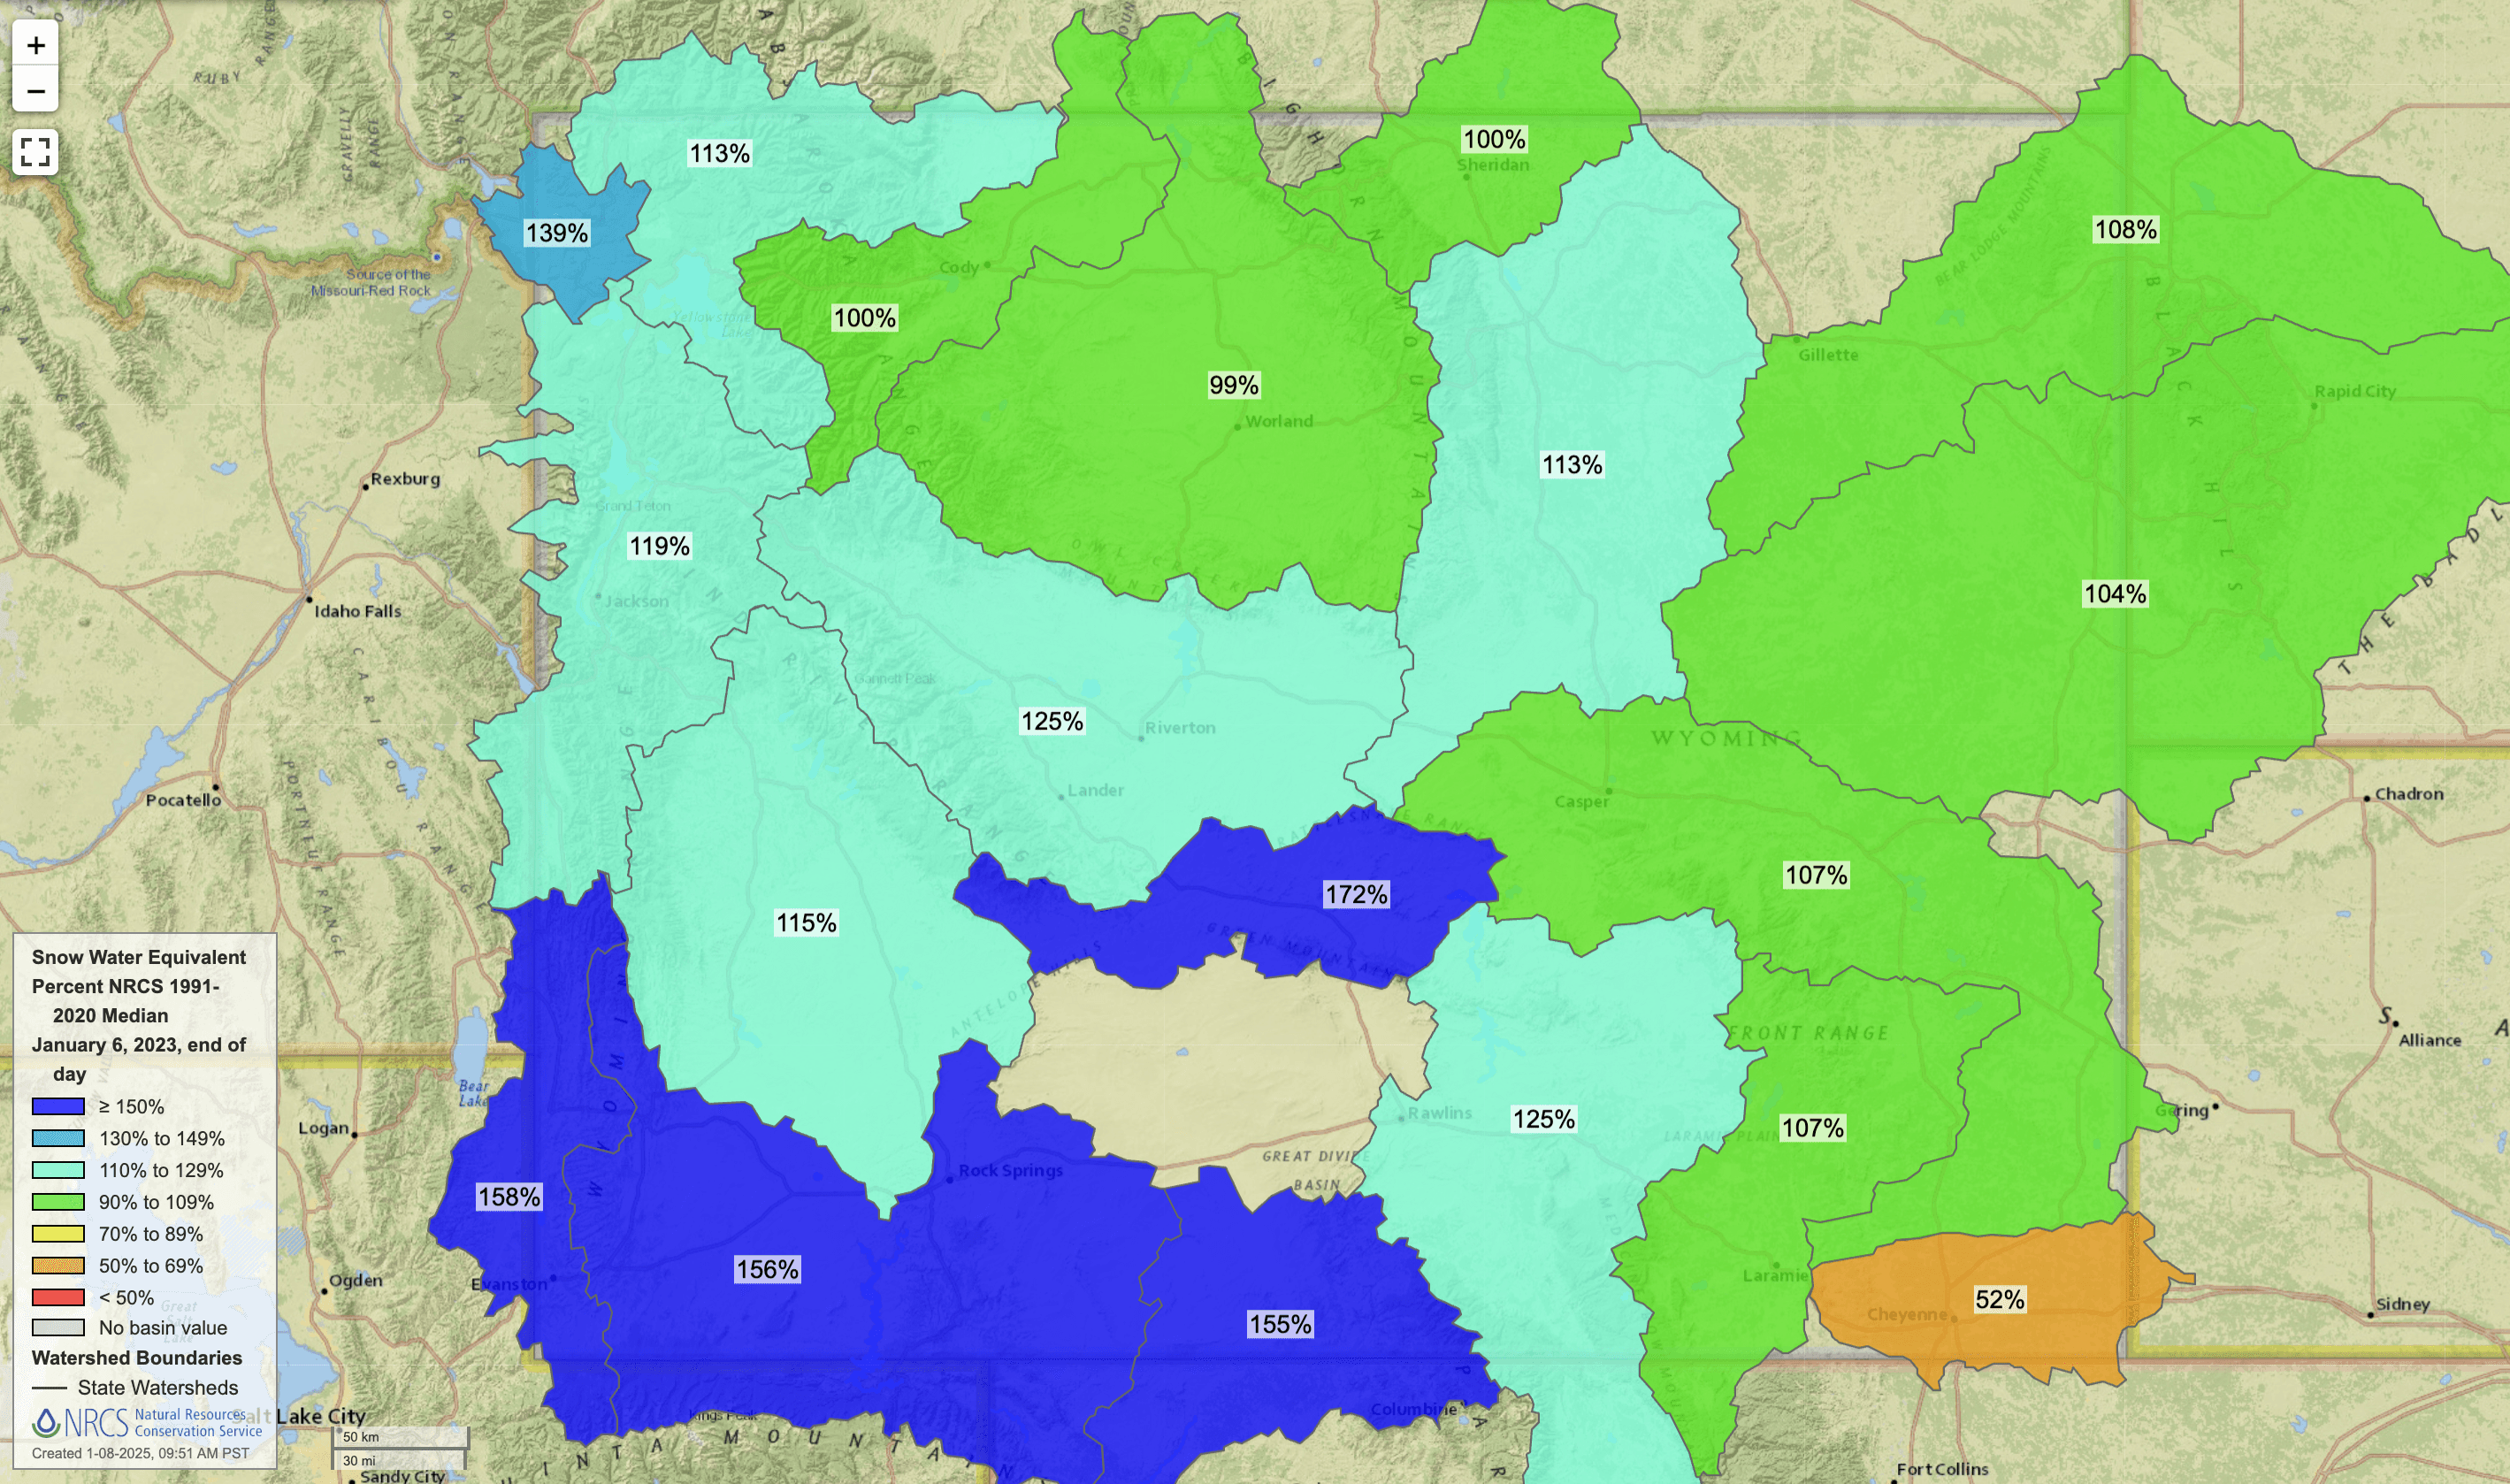
January 6, 2023, Wyoming snow water equivalent percent of normal.
How to access second choice draw odds on our standalone Draw Odds page.
Viewing designated wilderness areas in Wyoming on GOHUNT Maps.
Wyoming grizzly bear range in 1990 and 2020.
Area | 54-1 |
|---|---|
Trophy potential | 360”+ |
Regular preference point odds | 50% with 10 |
Special preference point odds | 50% with 12 |
Regular and special random odds | 0% |
Area | 54-2 |
Trophy potential | 360”+ |
Regular preference point odds | 100% with <15 |
Special preference point odds | 50% with 11 |
Regular and special random odds | 0% |
Area | 54-9 |
Trophy potential | 360”+ |
Regular preference point odds | 100% with 12 |
Special preference point odds | 100% with 10 |
Regular and special random odds | 0% |
Area | 56-1 |
Trophy potential | 360”+ |
Regular preference point odds | 25% with 19 |
Special preference point odds | 33% with 19 |
Regular and special random odds | 0% |
Area | 56-9 |
Trophy potential | 360”+ |
Regular preference point odds | 100% with <5 |
Special preference point odds | 67% with 1 |
Regular and special random odds | 0% |
Area | 58-1 |
Trophy potential | 350”+ |
Regular preference point odds | 50% with 12 |
Special preference point odds | 100% with 19 |
Regular and special random odds | 0% |
Area | 59-1 |
Trophy potential | 350”+ |
Regular preference point odds | 14% with 19 |
Special preference point odds | 20% with 19 |
Regular and special random odds | 0% |
Area | 59-9 |
Trophy potential | 350”+ |
Regular preference point odds | 100% with <4 |
Special preference point odds | 100% with 0 |
Regular and special random odds | 0% |
Area | 63 / 64-2 |
Trophy potential | 350”+ |
Regular preference point odds | 50% with 6 |
Special preference point odds | 100% with 5 |
Regular and special random odds | 0% |
Area | 51-2 |
Trophy potential | 350”+ |
Regular preference point odds | 100% with 7 |
Special preference point odds | 100% with 6 |
Regular and special random odds | 0% |
Area | 30-1 |
Trophy potential | 330”+ |
Regular preference point odds | 75% with 19 |
Special preference point odds | 50% with 19 |
Regular and special random odds | 0% |
Area | 32-1 |
Trophy potential | 330”+ |
Regular preference point odds | 100% with 19 |
Special preference point odds | 67% with 18 |
Regular and special random odds | 0% |
Area | Trophy potential | Regular preference point odds | Special preference point odds | Regular and special random odds |
|---|---|---|---|---|
54-1 | 360”+ | 50% with 10 | 50% with 12 | 0% |
54-2 | 360”+ | 100% with <15 | 50% with 11 | 0% |
54-9 | 360”+ | 100% with 12 | 100% with 10 | 0% |
56-1 | 360”+ | 25% with 19 | 33% with 19 | 0% |
56-9 | 360”+ | 100% with <5 | 67% with 1 | 0% |
58-1 | 350”+ | 50% with 12 | 100% with 19 | 0% |
59-1 | 350”+ | 14% with 19 | 20% with 19 | 0% |
59-9 | 350”+ | 100% with <4 | 100% with 0 | 0% |
63 / 64-2 | 350”+ | 50% with 6 | 100% with 5 | 0% |
51-2 | 350”+ | 100% with 7 | 100% with 6 | 0% |
30-1 | 330”+ | 75% with 19 | 50% with 19 | 0% |
32-1 | 330”+ | 100% with 19 | 67% with 18 | 0% |
Area | 7-1 |
|---|---|
Trophy potential | 350”+ |
Regular preference point odds | 31% with 13 |
Special preference point odds | 75% with 13 |
Regular random odds | 2.1% |
Special random odds | 4.5% |
Area | 63 / 64-1 |
Trophy potential | 350”+ |
Regular preference point odds | 43% with 16 |
Special preference point odds | 67% with 16 |
Regular random odds | 0.98% |
Special random odds | 2.1% |
Area | 63 / 64-3 |
Trophy potential | 350”+ |
Regular preference point odds | 34% with 15 |
Special preference point odds | 100% with 14 |
Regular random odds | 1.2% |
Special random odds | 2.7% |
Area | 51-9 |
Trophy potential | 350”+ |
Regular preference point odds | 100% with <10 |
Special preference point odds | 100% with 4 |
Regular random odds | 2.2% |
Special random odds | 17% |
Area | 51-1 |
Trophy potential | 350”+ |
Regular preference point odds | 75% with 16 |
Special preference point odds | 100% with 10 |
Regular random odds | 0.88% |
Special random odds | 3.9% |
Area | 61-1 |
Trophy potential | 340”+ |
Regular preference point odds | 100% with 14 |
Special preference point odds | 52% with 12 |
Regular random odds | 3.5% |
Special random odds | 4.9% |
Area | 62-1 |
Trophy potential | 340”+ |
Regular preference point odds | 34% with 16 |
Special preference point odds | 100% with 13 |
Regular random odds | 0.87% |
Special random odds | 1.9% |
Area | 100-1 |
Trophy potential | 340”+ |
Regular preference point odds | 65% with 19 |
Special preference point odds | 78% with 18 |
Regular random odds | 0.31% |
Special random odds | 0.99% |
Area | 16-1 |
Trophy potential | 340”+ |
Regular preference point odds | 100% with <18 |
Special preference point odds | 21% with 16 |
Regular random odds | 0.64% |
Special random odds | 1.6% |
Area | 16-2 |
Trophy potential | 340”+ |
Regular preference point odds | 56% with 18 |
Special preference point odds | 22% with 16 |
Regular random odds | 0.44% |
Special random odds | 2.3% |
Area | 19-1 |
Trophy potential | 340”+ |
Regular preference point odds | 100% with <12 |
Special preference point odds | 100% with <12 |
Regular random odds | 1.7% |
Special random odds | 5.7% |
Area | 19-2 |
Trophy potential | 340”+ |
Regular preference point odds | 17% with 11 |
Special preference point odds | 100% with 10 |
Regular random odds | 4.9% |
Special random odds | 7.7% |
Area | 22-1 |
Trophy potential | 340”+ |
Regular preference point odds | 17% with 17 |
Special preference point odds | 75% with 18 |
Regular random odds | 0.52% |
Special random odds | 0.79% |
Area | 45-9 |
Trophy potential | 340”+ |
Regular preference point odds | 35% with 13 |
Special preference point odds | 36% with <12 |
Regular random odds | 2.4% |
Special random odds | 4.6% |
Area | 45-1 |
Trophy potential | 340”+ |
Regular preference point odds | 20% with 12 |
Special preference point odds | 85% with 12 |
Regular random odds | 3.2% |
Special random odds | 12% |
Area | 24-1 |
Trophy potential | 330”+ |
Regular preference point odds | 100% with <17 |
Special preference point odds | 38% with 15 |
Regular random odds | 1.1% |
Special random odds | 6.9% |
Area | Trophy potential | Regular preference point odds | Special preference point odds | Regular random odds | Special random odds |
|---|---|---|---|---|---|
7-1 | 350”+ | 31% with 13 | 75% with 13 | 2.1% | 4.5% |
63 / 64-1 | 350”+ | 43% with 16 | 67% with 16 | 0.98% | 2.1% |
63 / 64-3 | 350”+ | 34% with 15 | 100% with 14 | 1.2% | 2.7% |
51-9 | 350”+ | 100% with <10 | 100% with 4 | 2.2% | 17% |
51-1 | 350”+ | 75% with 16 | 100% with 10 | 0.88% | 3.9% |
61-1 | 340”+ | 100% with 14 | 52% with 12 | 3.5% | 4.9% |
62-1 | 340”+ | 34% with 16 | 100% with 13 | 0.87% | 1.9% |
100-1 | 340”+ | 65% with 19 | 78% with 18 | 0.31% | 0.99% |
16-1 | 340”+ | 100% with <18 | 21% with 16 | 0.64% | 1.6% |
16-2 | 340”+ | 56% with 18 | 22% with 16 | 0.44% | 2.3% |
19-1 | 340”+ | 100% with <12 | 100% with <12 | 1.7% | 5.7% |
19-2 | 340”+ | 17% with 11 | 100% with 10 | 4.9% | 7.7% |
22-1 | 340”+ | 17% with 17 | 75% with 18 | 0.52% | 0.79% |
45-9 | 340”+ | 35% with 13 | 36% with <12 | 2.4% | 4.6% |
45-1 | 340”+ | 20% with 12 | 85% with 12 | 3.2% | 12% |
24-1 | 330”+ | 100% with <17 | 38% with 15 | 1.1% | 6.9% |
Area | 56-9 |
|---|---|
Trophy potential | 360” |
Regular preference point odds | 100% with <5 |
Special preference point odds | 67% with 1 |
Harvest success | 13% |
Percentage public land | 87% |
Area | 51-9 |
Trophy potential | 350” |
Regular preference point odds | 100% with <10 |
Special preference point odds | 100% with 4 |
Harvest success | 13% |
Percentage public land | 99% |
Area | 51-2 |
Trophy potential | 350” |
Regular preference point odds | 100% with 7 |
Special preference point odds | 100% with 6 |
Harvest success | 57% |
Percentage public land | 99% |
Area | 59-9 |
Trophy potential | 350” |
Regular preference point odds | 100% with <4 |
Special preference point odds | 100% with 0 |
Harvest success | 20% |
Percentage public land | 91% |
Area | 55-9 |
Trophy potential | 340” |
Regular preference point odds | 100% with 8 |
Special preference point odds | 50% with <6 |
Harvest success | 38% |
Percentage public land | 100% |
Area | 35-9 |
Trophy potential | 330” |
Regular preference point odds | More than 10 |
Special preference point odds | 100% with 7 |
Harvest success | 21% |
Percentage public land | 71% |
Area | 37-9 |
Trophy potential | 330” |
Regular preference point odds | 28% with 7 |
Special preference point odds | 82% with 5 |
Harvest success | 19% |
Percentage public land | 55% |
Area | 41-9 |
Trophy potential | 330” |
Regular preference point odds | More than 10 |
Special preference point odds | 23% with <9 |
Harvest success | 36% |
Percentage public land | 85% |
Area | 34-1 |
Trophy potential | 330” |
Regular preference point odds | 100% with <8 |
Special preference point odds | 57% with 5 |
Harvest success | 33% |
Percentage public land | 41% |
Area | 35-1 |
Trophy potential | 330” |
Regular preference point odds | 22% with 10 |
Special preference point odds | 60% with 3 |
Harvest success | 52% |
Percentage public land | 71% |
Area | 39-1 |
Trophy potential | 330” |
Regular preference point odds | 35% with 10 |
Special preference point odds | 55% with 7 |
Harvest success | 66% |
Percentage public land | 90% |
Area | 40-1 |
Trophy potential | 330” |
Regular preference point odds | 46% with 10 |
Special preference point odds | 100% with 9 |
Harvest success | 45% |
Percentage public land | 83% |
Area | 41-1 |
Trophy potential | 330” |
Regular preference point odds | 68% with 10 |
Special preference point odds | 100% with 6 |
Harvest success | 31% |
Percentage public land | 85% |
Area | 122-1 |
Trophy potential | 330” |
Regular preference point odds | More than 10 |
Special preference point odds | 100% with 8 |
Harvest success | 63% |
Percentage public land | 26% |
Area | 36-9 |
Trophy potential | 320” |
Regular preference point odds | 100% with 7 |
Special preference point odds | 67% with 4 |
Harvest success | 12% |
Percentage public land | 63% |
Area | 48-1 |
Trophy potential | 320” |
Regular preference point odds | 31% with 8 |
Special preference point odds | 50% with 2 |
Harvest success | 64% |
Percentage public land | 58% |
Area | 93-1 |
Trophy potential | 320” |
Regular preference point odds | 53% with 5 |
Special preference point odds | 47% with 3 |
Harvest success | 31% |
Percentage public land | 65% |
Area | 95-1 |
Trophy potential | 320” |
Regular preference point odds | 92% with 8 |
Special preference point odds | 100% with <6 |
Harvest success | 41% |
Percentage public land | 100% |
Area | 99-1 |
Trophy potential | 320” |
Regular preference point odds | More than 10 |
Special preference point odds | 100% with 9 |
Harvest success | 50% |
Percentage public land | 93% |
Area | 106-1 |
Trophy potential | 320” |
Regular preference point odds | 51% with 8 |
Special preference point odds | 100% with 5 |
Harvest success | 75% |
Percentage public land | 25% |
Area | 116-1 |
Trophy potential | 320” |
Regular preference point odds | 67% with 6 |
Special preference point odds | 71% with 4 |
Harvest success | 49% |
Percentage public land | 21% |
Area | 117-1 |
Trophy potential | 320” |
Regular preference point odds | 19% with 7 |
Special preference point odds | 100% with <8 |
Harvest success | 51% |
Percentage public land | 23% |
Area | 47-1 |
Trophy potential | 310” |
Regular preference point odds | 42% with <4 |
Special preference point odds | 100% with 0 |
Harvest success | 32% |
Percentage public land | 63% |
Area | 33-1 |
Trophy potential | 300” |
Regular preference point odds | 63% with 6 |
Special preference point odds | 86% with 6 |
Harvest success | 26% |
Percentage public land | 53% |
Area | Trophy potential | Regular preference point odds | Special preference point odds | Harvest success | Percentage public land |
|---|---|---|---|---|---|
56-9 | 360” | 100% with <5 | 67% with 1 | 13% | 87% |
51-9 | 350” | 100% with <10 | 100% with 4 | 13% | 99% |
51-2 | 350” | 100% with 7 | 100% with 6 | 57% | 99% |
59-9 | 350” | 100% with <4 | 100% with 0 | 20% | 91% |
55-9 | 340” | 100% with 8 | 50% with <6 | 38% | 100% |
35-9 | 330” | More than 10 | 100% with 7 | 21% | 71% |
37-9 | 330” | 28% with 7 | 82% with 5 | 19% | 55% |
41-9 | 330” | More than 10 | 23% with <9 | 36% | 85% |
34-1 | 330” | 100% with <8 | 57% with 5 | 33% | 41% |
35-1 | 330” | 22% with 10 | 60% with 3 | 52% | 71% |
39-1 | 330” | 35% with 10 | 55% with 7 | 66% | 90% |
40-1 | 330” | 46% with 10 | 100% with 9 | 45% | 83% |
41-1 | 330” | 68% with 10 | 100% with 6 | 31% | 85% |
122-1 | 330” | More than 10 | 100% with 8 | 63% | 26% |
36-9 | 320” | 100% with 7 | 67% with 4 | 12% | 63% |
48-1 | 320” | 31% with 8 | 50% with 2 | 64% | 58% |
93-1 | 320” | 53% with 5 | 47% with 3 | 31% | 65% |
95-1 | 320” | 92% with 8 | 100% with <6 | 41% | 100% |
99-1 | 320” | More than 10 | 100% with 9 | 50% | 93% |
106-1 | 320” | 51% with 8 | 100% with 5 | 75% | 25% |
116-1 | 320” | 67% with 6 | 71% with 4 | 49% | 21% |
117-1 | 320” | 19% with 7 | 100% with <8 | 51% | 23% |
47-1 | 310” | 42% with <4 | 100% with 0 | 32% | 63% |
33-1 | 300” | 63% with 6 | 86% with 6 | 26% | 53% |
Elk Regions | Eastern |
|---|---|
Nonresident regular preference point odds | 60% with 2 |
Nonresident special preference point odds | 100% with 0 |
Nonresident regular random odds | 40% |
Nonresident special random odds | 100% |
Elk Regions | Southern |
Nonresident regular preference point odds | 35% with 5 |
Nonresident special preference point odds | 87% with 3 |
Nonresident regular random odds | 7.3% |
Nonresident special random odds | 28% |
Elk Regions | Western |
Nonresident regular preference point odds | 50% with 5 |
Nonresident special preference point odds | 45% with <4 |
Nonresident regular random odds | 9.6% |
Nonresident special random odds | 32% |
Elk Regions | Nonresident regular preference point odds | Nonresident special preference point odds | Nonresident regular random odds | Nonresident special random odds |
|---|---|---|---|---|
Eastern | 60% with 2 | 100% with 0 | 40% | 100% |
Southern | 35% with 5 | 87% with 3 | 7.3% | 28% |
Western | 50% with 5 | 45% with <4 | 9.6% | 32% |
Elk Regions | Eastern |
|---|---|
Nonresident regular preference point odds | 80% with <5 |
Nonresident special preference point odds | 40% with 2 |
Nonresident regular random odds | 15% |
Nonresident special random odds | 40% |
Elk Regions | Southern |
Nonresident regular preference point odds | 93% with 5 |
Nonresident special preference point odds | 86% with <2 |
Nonresident regular random odds | 6.4% |
Nonresident special random odds | 68% |
Elk Regions | Western |
Nonresident regular preference point odds | 62% with <5 |
Nonresident special preference point odds | 95% with 4 |
Nonresident regular random odds | 9.8% |
Nonresident special random odds | 25% |
Elk Regions | Nonresident regular preference point odds | Nonresident special preference point odds | Nonresident regular random odds | Nonresident special random odds |
|---|---|---|---|---|
Eastern | 80% with <5 | 40% with 2 | 15% | 40% |
Southern | 93% with 5 | 86% with <2 | 6.4% | 68% |
Western | 62% with <5 | 95% with 4 | 9.8% | 25% |
2026 elk quotas | |
Region W | 2,775 |
Region S | 1,050 |
Region E | 500 |
Region W | Region S | Region E | |
|---|---|---|---|
2026 elk quotas | 2,775 | 1,050 | 500 |
Area | 56 |
|---|---|
Trophy potential | 360”+ |
Harvest success | 22% |
Branch - antlered bull success | 90% |
Number of bulls harvested | 70 |
Public land percentage | 87% |
Wilderness percentage | 54% |
Grizzly area | Yes |
Area | 59 |
Trophy potential | 350”+ |
Harvest success | 31% |
Branch - antlered bull success | 95% |
Number of bulls harvested | 136 |
Public land percentage | 91% |
Wilderness percentage | 75% |
Grizzly area | Yes |
Area | 60 |
Trophy potential | 340”+ |
Harvest success | 62% |
Branch - antlered bull success | 100% |
Number of bulls harvested | 136 |
Public land percentage | 100% |
Wilderness percentage | 100% |
Grizzly area | Yes |
Area | 12 |
Trophy potential | 320”+ |
Harvest success | 37% |
Branch - antlered bull success | 82% |
Number of bulls harvested | 293 |
Public land percentage | 57% |
Wilderness percentage | 0% |
Grizzly area | No |
Area | 13 |
Trophy potential | 320”+ |
Harvest success | 26% |
Branch - antlered bull success | 83% |
Number of bulls harvested | 189 |
Public land percentage | 74% |
Wilderness percentage | 11% |
Grizzly area | No |
Area | 15 |
Trophy potential | 320”+ |
Harvest success | 32% |
Branch - antlered bull success | 78% |
Number of bulls harvested | 193 |
Public land percentage | 62% |
Wilderness percentage | 0% |
Grizzly area | No |
Area | 86 |
Trophy potential | 320”+ |
Harvest success | 33% |
Branch - antlered bull success | 88% |
Number of bulls harvested | 140 |
Public land percentage | 96% |
Wilderness percentage | 0% |
Grizzly area | Maybe |
Area | 87 |
Trophy potential | 320”+ |
Harvest success | 24% |
Branch - antlered bull success | 100% |
Number of bulls harvested | 50 |
Public land percentage | 87% |
Wilderness percentage | 8% |
Grizzly area | Yes |
Area | 106 |
Trophy potential | 320”+ |
Harvest success | 36% |
Branch - antlered bull success | 86% |
Number of bulls harvested | 175 |
Public land percentage | 25% |
Wilderness percentage | 0% |
Grizzly area | No |
Area | 94 |
Trophy potential | 320”+ |
Harvest success | 30% |
Branch - antlered bull success | 77% |
Number of bulls harvested | 207 |
Public land percentage | 75% |
Wilderness percentage | 0% |
Grizzly area | No |
Area | 6 |
Trophy potential | 310”+ |
Harvest success | 45% |
Branch - antlered bull success | 97% |
Number of bulls harvested | 266 |
Public land percentage | 16% |
Wilderness percentage | 0% |
Grizzly area | No |
Area | 21 |
Trophy potential | 310”+ |
Harvest success | 35% |
Branch - antlered bull success | 67% |
Number of bulls harvested | 759 |
Public land percentage | 73% |
Wilderness percentage | 0% |
Grizzly area | No |
Area | 67 |
Trophy potential | 310”+ |
Harvest success | 22% |
Branch - antlered bull success | 99% |
Number of bulls harvested | 264 |
Public land percentage | 82% |
Wilderness percentage | 36% |
Grizzly area | Yes |
Area | 69 |
Trophy potential | 310”+ |
Harvest success | 36% |
Branch - antlered bull success | 100% |
Number of bulls harvested | 57 |
Public land percentage | 94% |
Wilderness percentage | 89% |
Grizzly area | Yes |
Area | 73 |
Trophy potential | 310”+ |
Harvest success | 39% |
Branch - antlered bull success | 91% |
Number of bulls harvested | 44 |
Public land percentage | 96% |
Wilderness percentage | 55% |
Grizzly area | Yes |
Area | 84 |
Trophy potential | 310”+ |
Harvest success | 35% |
Branch - antlered bull success | 97% |
Number of bulls harvested | 256 |
Public land percentage | 92% |
Wilderness percentage | 31.3% |
Grizzly area | Yes |
Area | 85 |
Trophy potential | 310”+ |
Harvest success | 24% |
Branch - antlered bull success | 100% |
Number of bulls harvested | 119 |
Public land percentage | 93% |
Wilderness percentage | 0% |
Grizzly area | Yes |
Area | 89 |
Trophy potential | 310”+ |
Harvest success | 26% |
Branch - antlered bull success | 96% |
Number of bulls harvested | 166 |
Public land percentage | 100% |
Wilderness percentage | 0% |
Grizzly area | No |
Area | 91 |
Trophy potential | 310”+ |
Harvest success | 26% |
Branch - antlered bull success | 96% |
Number of bulls harvested | 166 |
Public land percentage | 61% |
Wilderness percentage | 0% |
Grizzly area | No |
Area | 126 |
Trophy potential | 300”+ |
Harvest success | 35% |
Branch - antlered bull success | 92% |
Number of bulls harvested | 151 |
Public land percentage | 18% |
Wilderness percentage | 0% |
Grizzly area | No |
Area | 70 |
Trophy potential | 300”+ |
Harvest success | 41% |
Branch - antlered bull success | 100% |
Number of bulls harvested | 205 |
Public land percentage | 99% |
Wilderness percentage | 86.4% |
Grizzly area | Yes |
Area | 28 |
Trophy potential | 300”+ |
Harvest success | 33% |
Branch - antlered bull success | 86% |
Number of bulls harvested | 240 |
Public land percentage | 83% |
Wilderness percentage | 29.5% |
Grizzly area | Maybe |
Area | 71 |
Trophy potential | 300”+ |
Harvest success | 43% |
Branch - antlered bull success | 100% |
Number of bulls harvested | 102 |
Public land percentage | 100% |
Wilderness percentage | 83.6% |
Grizzly area | Yes |
Area | 102 |
Trophy potential | 300”+ |
Harvest success | 32% |
Branch - antlered bull success | 89% |
Number of bulls harvested | 230 |
Public land percentage | 75% |
Wilderness percentage | 0% |
Grizzly area | No |
Area | 68 |
Trophy potential | 300”+ |
Harvest success | 23% |
Branch - antlered bull success | 95% |
Number of bulls harvested | 82 |
Public land percentage | 87% |
Wilderness percentage | 7.2% |
Grizzly area | Yes |
Area | 110 |
Trophy potential | 300”+ |
Harvest success | 24% |
Branch - antlered bull success | 84% |
Number of bulls harvested | 311 |
Public land percentage | 73% |
Wilderness percentage | 12.9% |
Grizzly area | No |
Area | 128 |
Trophy potential | 300”+ |
Harvest success | 30% |
Branch - antlered bull success | 80% |
Number of bulls harvested | 88 |
Public land percentage | 81% |
Wilderness percentage | 0% |
Grizzly area | No |
Area | 90 |
Trophy potential | 300”+ |
Harvest success | 22% |
Branch - antlered bull success | 97% |
Number of bulls harvested | 101 |
Public land percentage | 100% |
Wilderness percentage | 0% |
Grizzly area | No |
Area | Trophy potential | Harvest success | Branch - antlered bull success | Number of bulls harvested | Public land percentage | Wilderness percentage | Grizzly area |
|---|---|---|---|---|---|---|---|
56 | 360”+ | 22% | 90% | 70 | 87% | 54% | Yes |
59 | 350”+ | 31% | 95% | 136 | 91% | 75% | Yes |
60 | 340”+ | 62% | 100% | 136 | 100% | 100% | Yes |
12 | 320”+ | 37% | 82% | 293 | 57% | 0% | No |
13 | 320”+ | 26% | 83% | 189 | 74% | 11% | No |
15 | 320”+ | 32% | 78% | 193 | 62% | 0% | No |
86 | 320”+ | 33% | 88% | 140 | 96% | 0% | Maybe |
87 | 320”+ | 24% | 100% | 50 | 87% | 8% | Yes |
106 | 320”+ | 36% | 86% | 175 | 25% | 0% | No |
94 | 320”+ | 30% | 77% | 207 | 75% | 0% | No |
6 | 310”+ | 45% | 97% | 266 | 16% | 0% | No |
21 | 310”+ | 35% | 67% | 759 | 73% | 0% | No |
67 | 310”+ | 22% | 99% | 264 | 82% | 36% | Yes |
69 | 310”+ | 36% | 100% | 57 | 94% | 89% | Yes |
73 | 310”+ | 39% | 91% | 44 | 96% | 55% | Yes |
84 | 310”+ | 35% | 97% | 256 | 92% | 31.3% | Yes |
85 | 310”+ | 24% | 100% | 119 | 93% | 0% | Yes |
89 | 310”+ | 26% | 96% | 166 | 100% | 0% | No |
91 | 310”+ | 26% | 96% | 166 | 61% | 0% | No |
126 | 300”+ | 35% | 92% | 151 | 18% | 0% | No |
70 | 300”+ | 41% | 100% | 205 | 99% | 86.4% | Yes |
28 | 300”+ | 33% | 86% | 240 | 83% | 29.5% | Maybe |
71 | 300”+ | 43% | 100% | 102 | 100% | 83.6% | Yes |
102 | 300”+ | 32% | 89% | 230 | 75% | 0% | No |
68 | 300”+ | 23% | 95% | 82 | 87% | 7.2% | Yes |
110 | 300”+ | 24% | 84% | 311 | 73% | 12.9% | No |
128 | 300”+ | 30% | 80% | 88 | 81% | 0% | No |
90 | 300”+ | 22% | 97% | 101 | 100% | 0% | No |
Preference points |
Total nonresidents |
20 |
571 |
19 |
731 |
18 |
776 |
17 |
941 |
16 |
1,253 |
15 |
1,601 |
14 |
2,019 |
13 |
2,404 |
12 |
3,040 |
11 |
3,681 |
10 |
4,531 |
9 |
6,005 |
8 |
7,787 |
7 |
11,744 |
6 |
16,912 |
5 |
22,894 |
4 |
26,090 |
3 |
26,941 |
2 |
29,668 |
1 |
39,092 |
Total |
208,681 |
Preference points | Total nonresidents |
20 | 571 |
19 | 731 |
18 | 776 |
17 | 941 |
16 | 1,253 |
15 | 1,601 |
14 | 2,019 |
13 | 2,404 |
12 | 3,040 |
11 | 3,681 |
10 | 4,531 |
9 | 6,005 |
8 | 7,787 |
7 | 11,744 |
6 | 16,912 |
5 | 22,894 |
4 | 26,090 |
3 | 26,941 |
2 | 29,668 |
1 | 39,092 |
Total | 208,681 |
Wyoming offers some of the West’s premier elk hunting opportunities. From highly sought-after limited quota tags to exciting general season hunts, the Cowboy State delivers quality options for every type of elk hunter. The application deadline for nonresident Wyoming elk is February 2, 2026, at 11:59 p.m. MT, and all applications must be submitted online andyou can apply here. Resident limited quota elk applications are due by June 1, 2026.
This article will provide you with all of the latest and greatest information that you need to know about when applying for elk in Wyoming for the 2026 hunting season. Dive in and start your research today on Insider!
Not much has changed going into the 2026 season. Really, the biggest thing pertaining to the nonresident draw is the application deadline, and point buying dates are slightly different than normal. These are highlighted in multiple places throughout this article, so make sure you don’t miss these deadlines. Preference point reminder: Unsuccessful applicants will not automatically be given a preference point if unsuccessful in the draw. You must purchase a point during the point only timeframe, which is July 1 to Nov. 2, 2026. Cost is $52 for adults and $10 for youth.
Visit our State Profile to view important information and an overview of the Wyoming rules/regulations, the draw system, preference points, SuperTag/SuperTag Trifecta tag, and license fees, and an interactive boundary line map. You can also view the Wyoming Elk Profile to access historical and statistical data to help you find trophy areas.
* The costs above do not include a 2.5% processing fee on the total transaction amount. For example, if you applied for special full price elk, you will pay an additional $32.45 in fees.
** Nonresident youth who apply in the special draw will pay the full special license cost.
Note: Even if you are unsuccessful in the draw, you will not automatically be given a preference point. Preference points must be bought during the summer/fall point only time frame.
2026
2025
2024
2023
Point Tracker allows you to enter the number of points you have for each state and species and, as you research through Filtering and Draw Odds, your point total will automatically be highlighted. Learn more about using Point Tracker below:
GOHUNT displays the number of applicants at each point level below the cut-off draw line for each hunt on the detailed draw odds page. This gives applicants a much greater understanding of point creep for each hunt and allows them to apply with a much better understanding of their chances. Check out a great article on point creep here and how to find the detailed draw odds page for each hunt.
Whether you’re a first timer or have been applying for years, Wyoming’s draw system can still be a bit confusing. Below you’ll find details on how it works, and hopefully, it will make your application process easier.
The nonresident elk draw works on a modified preference point system where 75% of the licenses are allocated to applicants with the most preference points, and the other 25% are randomly allocated. The Wyoming preference point system is a true preference point system, meaning that the licenses for any given hunt are allocated to the applicants with the most points who apply. Basically, they work from the top down.
After the preference point licenses are allocated, all unsuccessful applicants have a chance in the random draw. There is no weight given to the number of points you have in the random draw. For example, an applicant with 10 points and an applicant with one point have the same odds in the random draw.
There is no point system for resident elk. The draw is completely random for resident elk applicants.
Wyoming offers two separate draws for nonresidents: the regular draw and the special draw. Nonresidents can apply in either the regular draw or the special draw, but they cannot apply in both. The special draw license is $1,258 more than the regular draw license. The potential benefit of applying for hunts in the special draw is that the odds of drawing may be better (or potentially take fewer points) due to the fact that, often, fewer people are willing to pay the higher price. However, this is not always the case, especially for a lot of the more highly sought after licenses.
Review the Draw Odds to see if the odds are actually better in the special draw and worth the added cost. In some cases, it is. For example, the western region general season elk license in the special draw had random odds of 25% while the random odds in the regular draw were 9.8%. That is a 15.2% increase in odds for the special draw at a cost difference of $1,258. That may or may not be worth it to you, but it’s worth considering for the hunt(s) you apply for.
Wyoming’s elk licenses are split between residents and nonresidents: 84% are allocated to residents, and 16% allocated to nonresidents. Out of the nonresident licenses, 60% of those are allocated to the regular draw and 40% are allocated to the special draw. One additional split offers 75% of licenses to the highest preference point applicants, and the other 25% are randomly allocated.
Note: There must be at least four licenses for any given hunt to offer one in the random draw. When reviewing the odds, if you have fewer than maximum points for the hunt you are considering, make sure there are odds displayed all the way to the zero point level, which means there was at least one random license available. This should be a good indicator that there will also be a random tag available going into this year's draw. Every year, applicants apply for tags without random tags available, and it’s pretty much a wasted application at that point.
Wyoming allows up to six hunters to apply together on a party application for elk. A party is treated as a single application, and if it draws, every member of the party receives a license. Preference points for party applications are averaged to the fourth decimal place. For example, if three hunters apply together with seven, five, and two preference points, the party enters the draw with an average of 4.6666 points.
Wyoming will over-allocate licenses to accommodate party applications, so applying as a group does not reduce your odds. For example, if only one license remains and a three-person party application is selected, the Wyoming Game and Fish Department (WGFD) will still issue licenses to all three hunters. Keep in mind that residents and nonresidents cannot apply together on the same party application.
To apply as a party, one individual must act as the Party Organizer. That person selects “Party Organizer” during the application process and is assigned a party ID, which includes the organizer’s last name and a six-digit number. The organizer must share this party ID with the rest of the group. All other applicants select “Party Member” and enter the party ID when applying. Once the party ID is entered, applicants will be taken to the application screen, but they will not be able to change the species, draw type (regular or special), hunt area, or license type, as all party members must apply for the exact same options selected by the organizer.
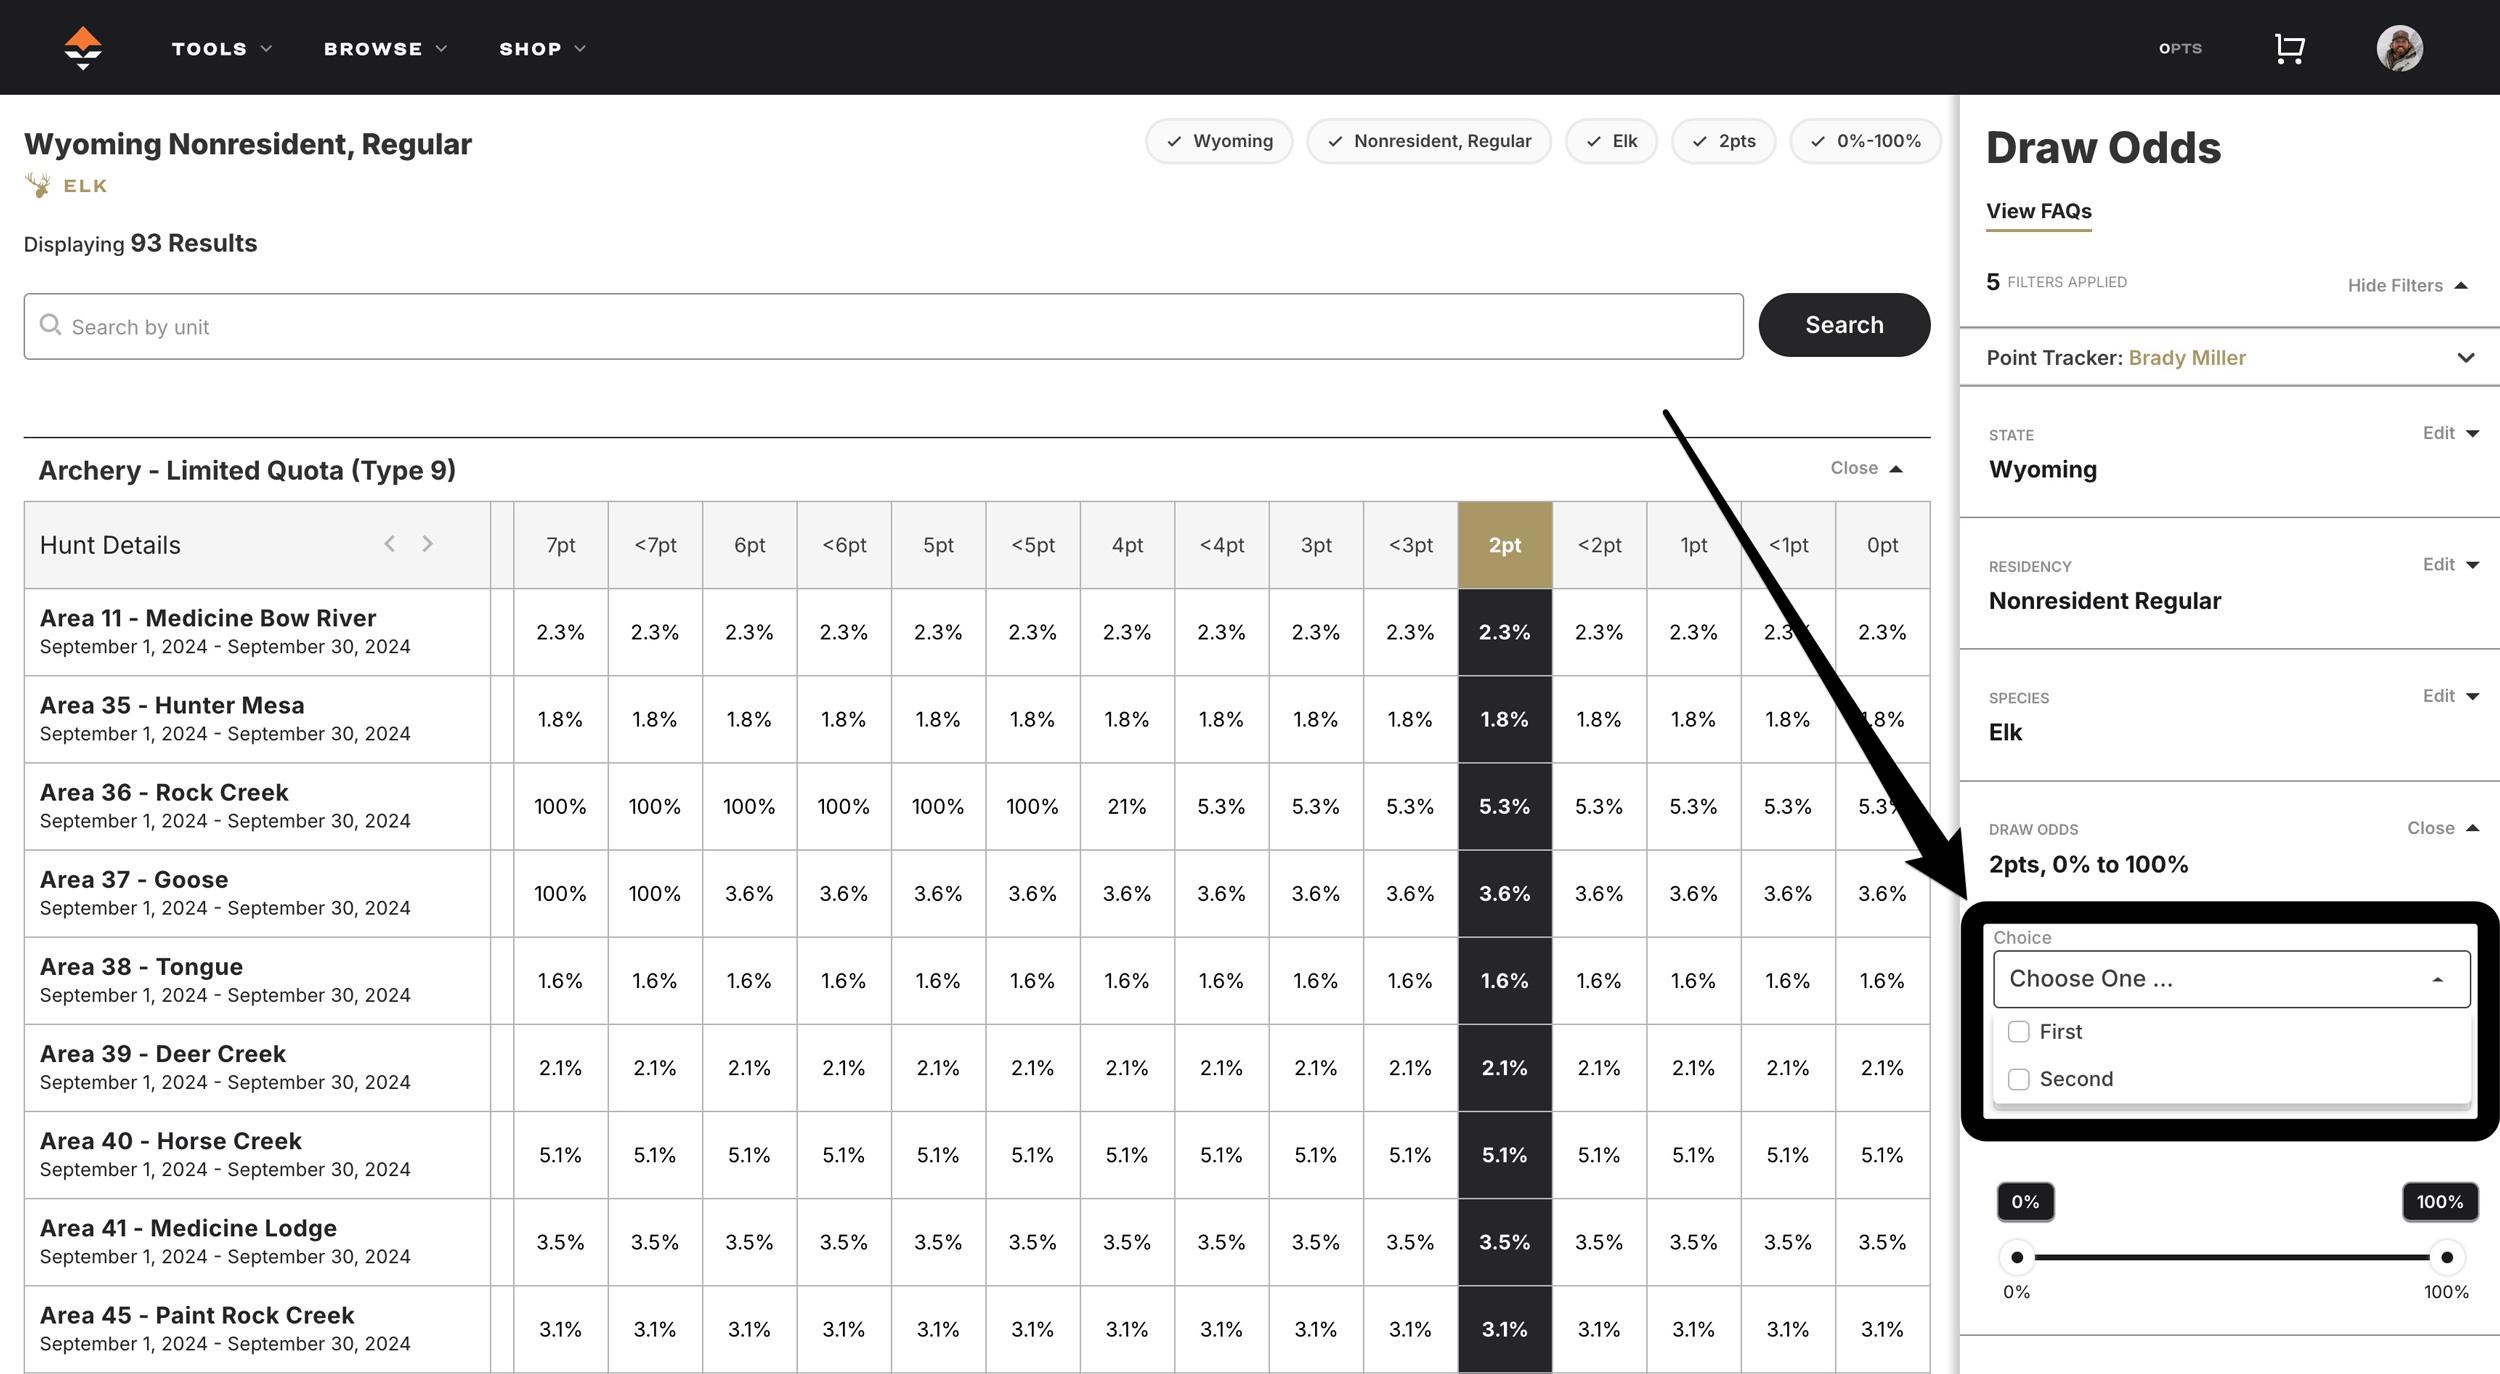
Applicants have three choices when they apply: first, second, and third. Every applicant's first choice is considered before moving to any applicant's second or third choice. In essence, to draw a hunt as a second or third choice, there must be licenses remaining after every applicant's first choice has been considered. Your preference points will only be purged if you draw your first choice (reduced price licences are not affected by this). I would suggest using your Insider account to see what hunts could be available this year for a second choice option. You can see those by filtering by “second choice” in the standalone Draw Odds page.
The full price and reduced price hunts are separate draws. The full price draw works on the preference point system. The reduced price draw is completely random. Reduced price licenses are Types 6, 7, and 8, which are all antlerless (cow/calf) licenses. Full price licenses are Type 1, 2, 9, 4, 5, and 0. Preference points will not be impacted if you apply for and draw a reduced-price license. Applicants can apply for both the full price and reduced price draw.
TYPE 1 LICENSE
A Type 1 is a rifle license valid for the season and weapon as indicated within the Wyoming regulations. In addition, most Type 1 licenses will also allow hunters to purchase an over-the-counter (OTC) archery stamp and bowhunt during the entire month or a portion of September.
TYPE 2 LICENSE Most often, a Type 2 license will vary by season or boundary. For example, some areas may have both a Type 1 and a Type 2 license, where the only difference is the start and ending season dates. Other units may have a Type 1 and Type 2 license, where the difference is that they are valid for different portions of the area. A Type 2 is also a rifle hunt. Hunters may be able to purchase an OTC archery stamp and hunt all or a portion of the archery season. See regulations for details.
TYPE 9 LICENSE
Archery only hunts that are valid in the hunt area and during the archery dates indicated.
GENERAL LICENSE
The general season license allows hunters to rifle hunt in any or all general hunt areas within their region. Successful applicants can also buy an OTC archery stamp that will allow them to hunt with a bow and arrow in general season areas during all or a portion of September. See rules and regulations for details.
TYPE 4 AND 5
These are full-priced cow/calf licenses. One thing to be aware of is that if you apply for one of these licenses as your first choice and draw it, you will lose any preference points you have accrued. So if you are in the mode of building elk points for a more desirable unit, then a Type 4 or 5 license should be a second choice option only.
TYPE 6 AND 7
Type 6 and Type 7 are reduced-price licenses and will not utilize preference points. You can apply for those on a separate application within the state draw system. The drawing for reduced-price licenses is random, with no point system.
Any remaining licenses after the resident and nonresident draws will be available in a leftover draw. Residents and nonresidents can apply. There is no application fee and no point system. You must front the cost of the license when you apply. Unsuccessful applicants will be refunded back to the card used to apply. The leftover draw time frame is tentatively scheduled for June 22 to 26, 2026, and results should be available July 9 (tentative).
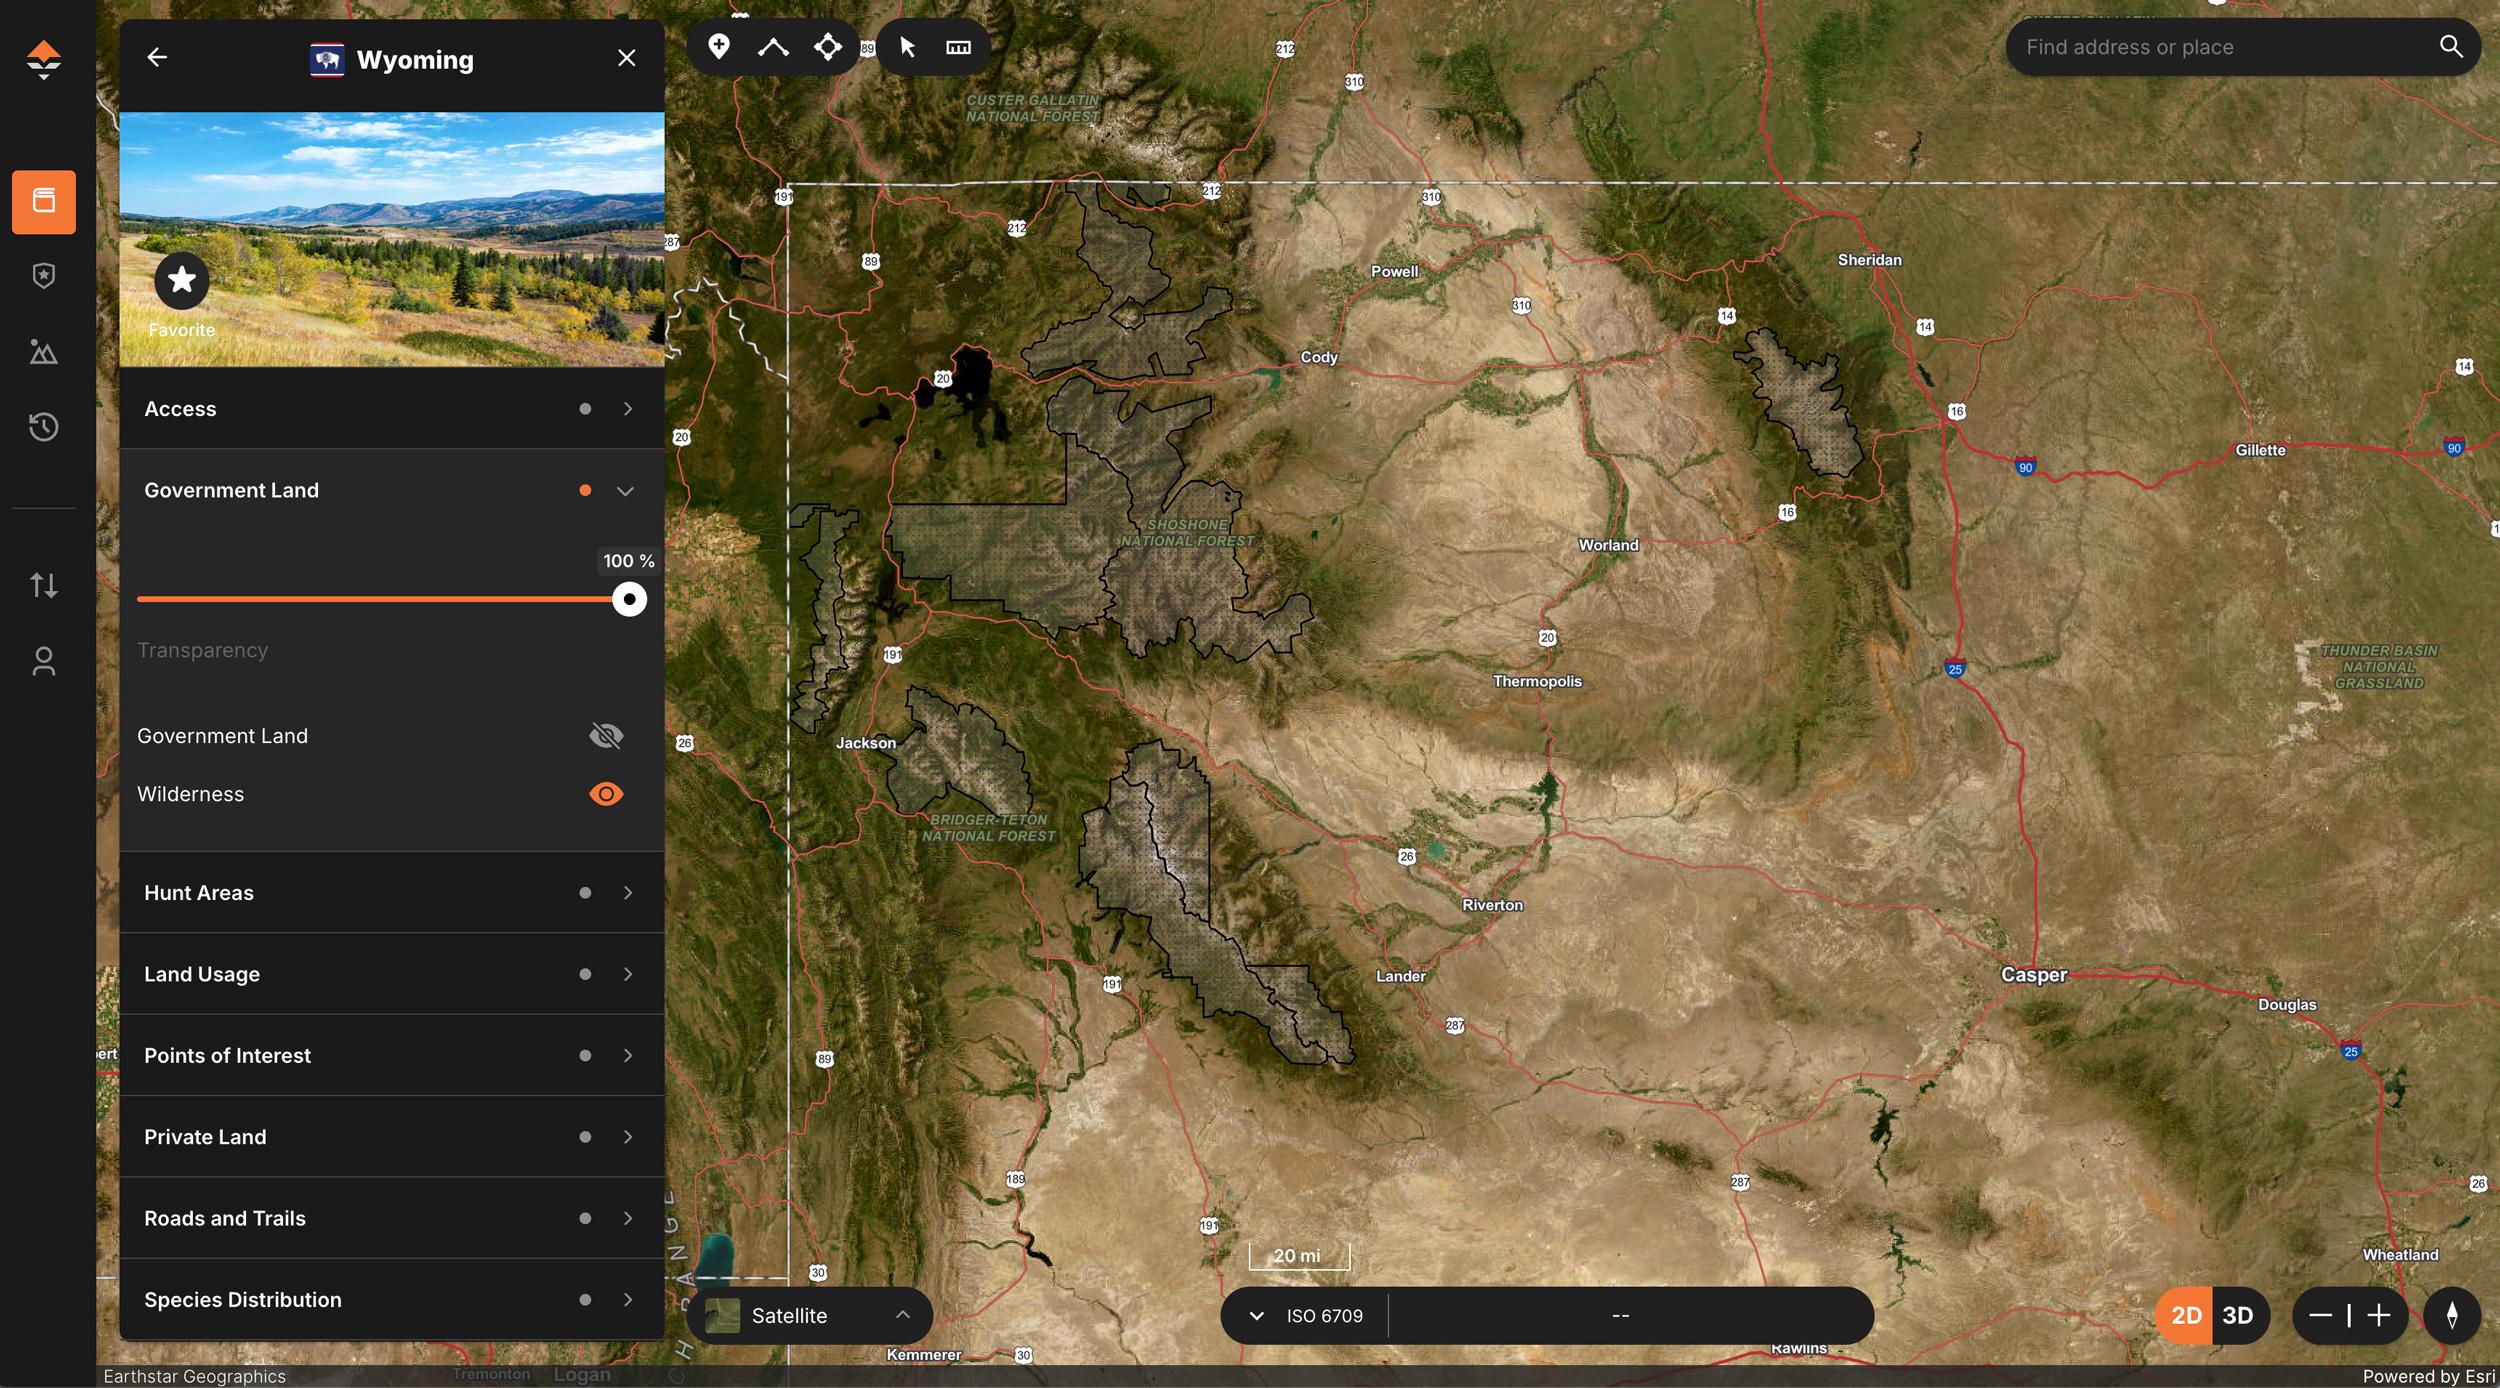
Each year, we speak with nonresident applicants who unintentionally apply for licenses in hunt areas that are largely—or entirely—within Designated Wilderness Areas (DWAs). Before applying, it’s critical to understand that nonresidents may not hunt in a DWA without being accompanied by either a licensed Wyoming outfitter or a licensed Wyoming resident guide. DWAs are designated by the U.S. Forest Service (USFS). If a Wyoming resident agrees to guide a nonresident into a DWA, they must visit a Wyoming Game and Fish Department (WGFD) office in person to obtain a resident guide license; this process cannot be completed online.
It’s also important to distinguish DWAs from Wilderness Study Areas (WSAs). WSAs are designated by the Bureau of Land Management (BLM), and nonresidents are allowed to hunt in these areas without a guide.
Many hunt areas contain substantial portions of USFS-designated wilderness. Before applying, take the time to research these boundaries carefully. Tools like the GOHUNT Maps platform allow you to overlay hunt units, land ownership, and wilderness layers to identify where DWAs exist. While hunting within DWAs can be excellent, you should only apply for these areas if you have a solid plan in place—either an agreement with an outfitter or arrangements to hunt alongside a qualified Wyoming resident. Do your homework and apply accordingly.
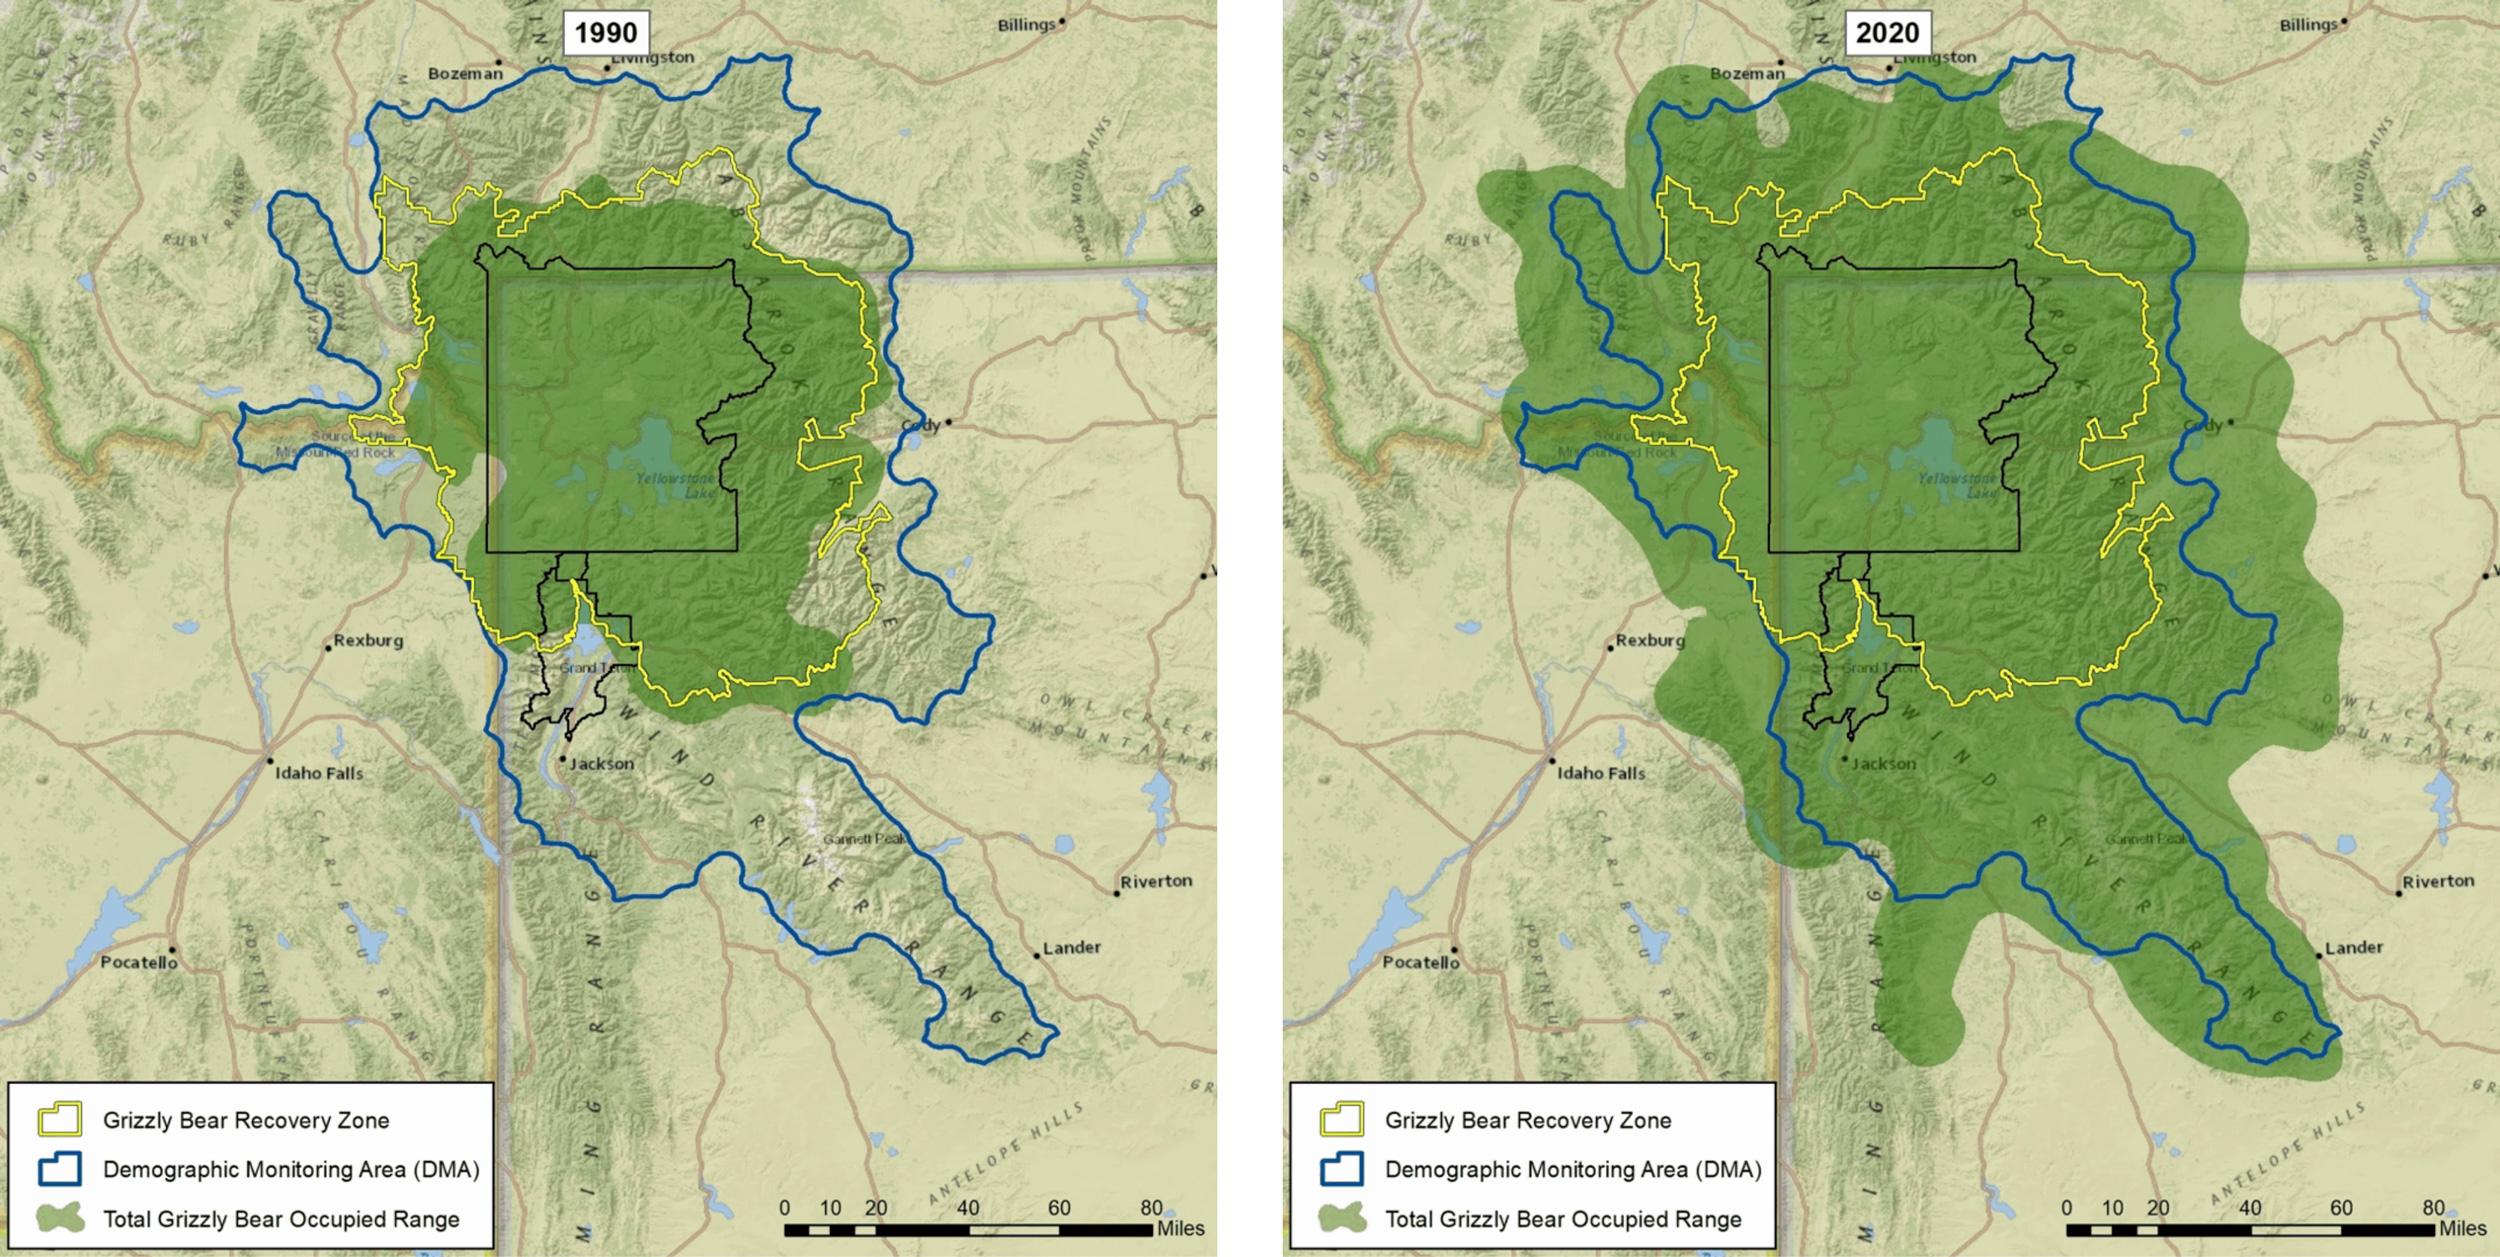
The most recent population estimate is somewhere between 1,000 to 1,100 grizzly bears just in the greater Yellowstone region. Some more accurate reports show approximately 1,070 grizzly bears today.
Hunting in grizzly country can be intimidating and is a cause for concern. My biggest piece of advice would be to take the proper precautions needed and give them the respect they deserve. If hunting in occupied grizzly bear areas is something you do not want to do, please do some research and apply for areas where that is not an issue.
At a minimum, we strongly recommend purchasing an elk preference point during the summer or early fall point-only purchase period. Most areas of Wyoming are currently above population objectives, and the state continues to offer one of the best balances of opportunity and trophy potential. While Wyoming isn’t known as a premier destination for 360"+ bulls, the majority of units consistently produce bulls in the 300" class, with a respectable number of 330"–350" bulls harvested each year.
One of the biggest benefits of a Wyoming elk license is the extended season structure. Many Type 1 and select Type 2 hunts allow hunters to archery hunt during the peak of the rut and return in October for a rifle season if they’re unsuccessful with a bow. For archery-focused hunters, several Type 9 archery-only licenses are available and are generally easier to draw. Wyoming also offers solid antlerless opportunities through full-price Type 4 and Type 5 cow elk licenses, many of which can be drawn as a second choice. Additionally, reduced-price Type 6 and Type 7 licenses—valid for cow or calf elk—should not be overlooked. These licenses are issued through a separate, random draw, and drawing one does not impact your preference points.
Heading into the 2026 draw, the maximum number of preference points for full-price elk licenses is 20. Many of Wyoming’s top elk hunts now require the maximum number of points, and even then, several of these hunts have effectively shifted back to the random draw because of the growing pool of maximum point holders.
When evaluating hunts that offer the best potential for a trophy bull, it’s important to understand the factors that consistently produce older, larger bulls. In Wyoming, these tend to be hunt areas with limited access and/or very few licenses. Restricted access—often due to private land or Designated Wilderness Areas (DWAs)—creates refuge and allows bulls to reach older age classes. For nonresident hunters, these areas can also present better draw odds, as limited public access generally reduces applicant demand. If a hunter’s goal is to pursue larger bulls without holding maximum points, a guided or outfitted hunt on private land or within a DWA may be a realistic option.
There are also hunts specifically managed for quality bulls that feature extensive public land and good access. These areas are typically the most desirable and, as a result, the hardest to draw. Applicants should understand that when trophy quality, access, and public land all align, draw odds will be extremely low. Planning accordingly and setting realistic expectations is key when applying for these highly sought-after units.
In the table below, we break out the best trophy units with the associated number of points/odds to draw those hunts.
Note: the hunts in the table above did not offer randomly allocated licenses, so if you’re not anywhere near the point break level, then you are wasting your application.
While there are plenty of hunts available with fewer than maximum points, finding them requires some effort and research. These hidden gems are typically linked to factors such as lower trophy potential, limited public land access, archery-only Type 9 hunts or nontraditional elk habitats. The tables below highlight the top hunts for applicants with mid-tier point levels.
Note: Some of these areas have some portion that is within DWAs. Before applying, research the availability of land to hunt and access if you are unguided.
Additional information is available in the Insider Unit Profiles and in the map portion of your account. Insiders should cross-reference the odds and units they are interested in with the unit profiles and mapping platform to find the best fit for their specific situations. Use all of the tools available: trophy potential, season, public land percentage, and harvest success to explore the possibilities.
The general season elk license is one of the best opportunities for applicants who do not have many points. Many of the general units also hold some phenomenal quality bulls that you typically won't find with other states' general hunts.
One of the biggest and most evident takeaways from the general region elk draws is that both the regular and special draw for region E (eastern region) went down. My guess is this is mainly due to the private vs public land battle on the eastern side of the state. Plenty of elk and plenty of tags, but finding a place to hunt is the hurdle. So if you have connections or you don’t mind chasing the small chunks available to hunt, then this might be the option for you. The other two regions either held steady or fluctuated +/-. Follow the recent draw trends for the best prediction for what might take place this draw cycle.
As a reminder, if you plan to apply for a general region elk license, you are actually applying for the rifle license. There is no archery general elk license to apply for. You apply for the rifle license, then purchase the archery stamp in order to bowhunt during the general season.
In the table below, we break down the top general season units based on trophy potential, harvest success, branch antlered bull success, public land, and whether or not the area is within occupied grizzly habitat.
Wyoming works on a preference point system. You can earn a preference point by purchasing one between July 1 and November 2, 2026. Points are not automatically awarded if you're unsuccessful in the draw. For nonresidents, an elk preference point costs $52. The maximum number of points for elk heading into the 2026 draw is 20. It's worth noting that the youth preference point fee for elk is just $10, making Wyoming an excellent state to start building points for young hunters.
Comparing the 2025 point totals with the totals going into the 2026 draw, there was a 6.1% increase, increasing from 195,882 to 208,681. Compared to previous years, the increase seems to have slowed a bit.
Residents: The Wyoming resident draw process is 100% random for deer, elk and antelope. There are no preference points for residents.
Point creep is a topic that comes up every year, and it’s worth taking the time to clearly understand how it works. As mentioned earlier, Wyoming implemented its nonresident elk preference point system 20 years ago, and there are now thousands of applicants holding points in the elk draw. Because of this, point creep is a very real and ongoing issue. Simply put, point creep occurs when there are more applicants than available licenses, causing the number of points required to draw a tag to increase over time—often by at least one point per year.
Point creep is further compounded by applicants who have been purchasing and banking preference points for years without actively applying. Another contributing factor is when hunters grow tired of chasing elite, top-tier hunts and instead shift their applications to hunts they now have enough points to draw. The influx of point holders changing strategies or entering the draw after years of banking points can accelerate point creep even more.
It’s important to understand that GOHUNT Draw Odds show the breakdown of applicants at each point level, specifically below the threshold needed to guarantee a license in previous years. This feature helps you assess how many applicants at your current point level might be entering the draw, giving you a clearer idea of your chances of drawing a preference point license. It's crucial to review the detailed draw odds pages for the hunts you're interested in. If you choose not to, I recommend targeting hunts that were awarded with one or two points fewer than what you currently have.
To wrap things up, Wyoming should remain near the top of your application strategy. Whether you’re focusing on limited-quota units or general areas, the combination of elk numbers and overall quality in the Cowboy State is hard to beat. Elk populations remain strong statewide, and when you factor in Wyoming’s longer seasons, it clearly earns a spot in the “must-apply” category.
Be sure to take full advantage of the research tools available through the Insider platform to fine-tune your strategy before applying. Best of luck to everyone in the 2026 draw.
You can apply for elk beginning Jan. 2, 2026, at 8:00 a.m. MT.
The nonresident deadline to apply is Feb. 2, 2026, by 11:59 p.m. MT.
The resident deadline to apply is June 1, 2026, by 11:59 p.m. MT.
Apply online here. Applications are only accepted online.
The deadline to amend or withdraw your nonresident elk application is May 8, 2026, by 11:59 p.m. MT.
Nonresident draw results will be available on May 21, 2026, tentatively.
Applicants must front the entire cost of the license(s) they apply for on a debit or credit card.
Refunds for unsuccessful applicants will be returned to the credit or debit card that was used.
Ensure that the credit card used has an expiration date valid through the time period in which the drawing will be conducted.
The preference point only purchase period is from July 1 to November 2, 2026.
You do not need to apply in the draw if you only want to purchase a preference point in the preference point only timeframe noted above.
Failure to apply or purchase preference points for two consecutive years will cause all previous points accumulated to be purged.
You cannot return an elk license for a refund or get preference points back.